Calculated variables
 Updated
by
Leigh Hutchens
Updated
by
Leigh Hutchens
- Visibility & Setup
- Adding a calculated variable
- Example of a calculated variable
- Example of a multiple operator calculated variable
- Calculated variables based on a calculated variable
- View calculated variables in schedule - Statistics
- View calculated variables in the Dashboard
- View calculated variables in the Forecast Overview
Visibility & Setup
Any role with access to account settings can add new calculated variables using input data, standard variables, active forecast variables, actual, or budget data.
The variable can be set up with up to four operations and calculated using multiply by, divided by, percent of, minus and plus equations.
When any new calculated variable is added, then visibility will be set to YES for both the schedule and dashboard by default. You can change this at any time; however, any calculated variable that includes cost data (actual staff cost, expected staff cost) will currently be hidden from the dashboard.
You can edit an existing calculated variable at any time without changing any of the underlying data.
Adding a calculated variable
Calculated variables are configured from Optimization settings > Variable Settings > Add > Calculated Variable.
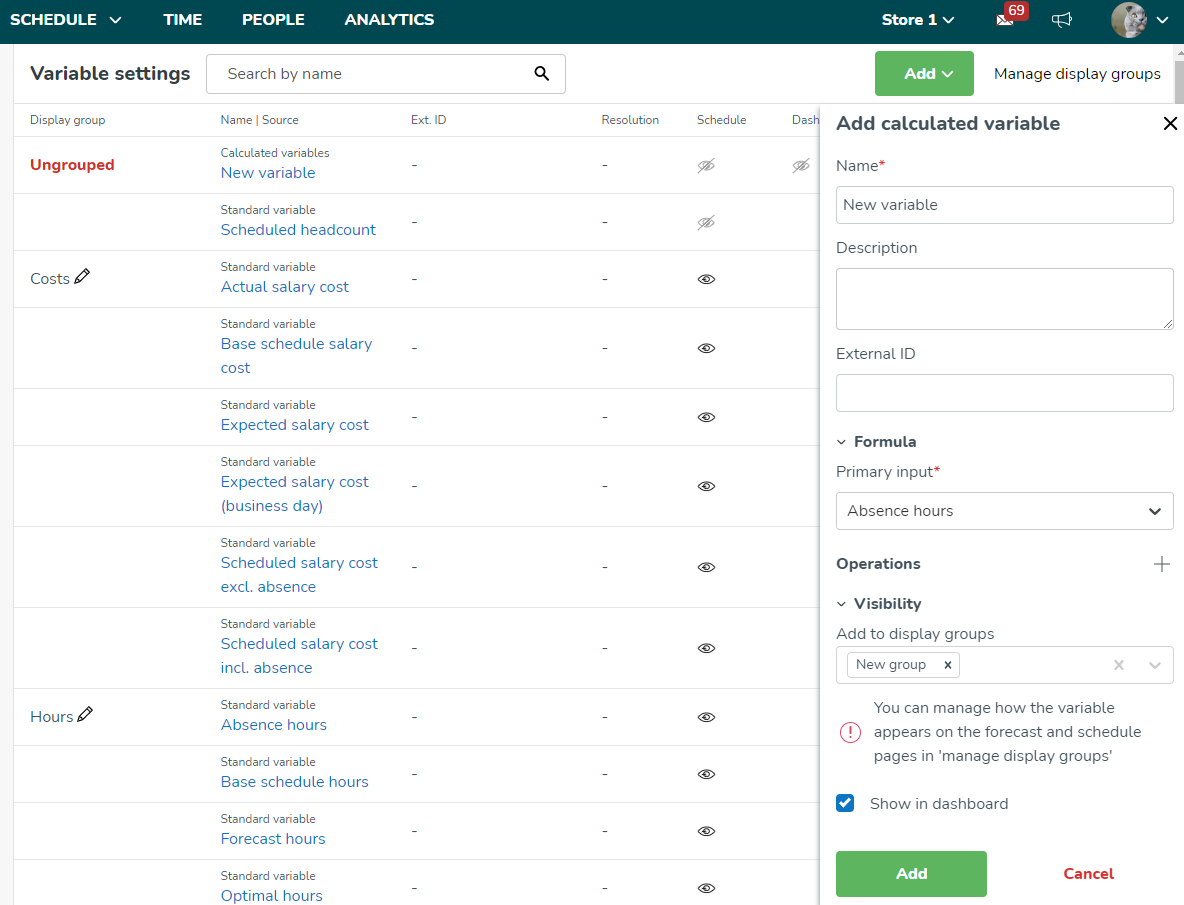
When adding a calculated variable, you are presented with the following options:
Name | The name of your calculated variable and how it will be presented in different views |
Description | The description of your calculated variable will be visible in the system as a reference to the calculated variable. |
Formula | This is where you define the calculation of your variable. |
Primary input | The Primary input is the first variable you want to use for your calculation. You can choose from the standard variables and also from Forecast variables and configurations if you have Neo Forecast activated for your organization. This will be the input data before the operator. |
Custom Input | Allows you to add a specific figure to the custom variable equation in place of a second variable. Note that no calculation will be performed if the data on the primary input is 0. NOTE: these calculations will be performed at the resolution that your input data is set to; 5min, 15min, 30min, and 60min. |
Operations | The operator decides what should happen with the data you choose to create a calculated variable with. You can click the + to add up to four operations in one calculated variable. The available operators are:
|
Visibility | To define where the calculated variable is visible and what display groups the variable should be a part of. This determines which display group(s) the input data will be displayed in. For the standard variables that are automatically added to default display groups, such as Costs and Hours, as well as the Optimal Headcount variables that are added to the default display group Labor, Quinyx has a small but significant component indicator in the Visibility input that will represent those default display groups. This helps users by providing information about whether a variable is part of any default display group already. |
Show in statistics (schedule) | Define whether this should be visible in Statistics in the schedule view. |
Show in dashboard | Define whether this should be visible in the dashboard view. Note: Currently, variables with salary cost calculations will not be shown in the dashboard. |
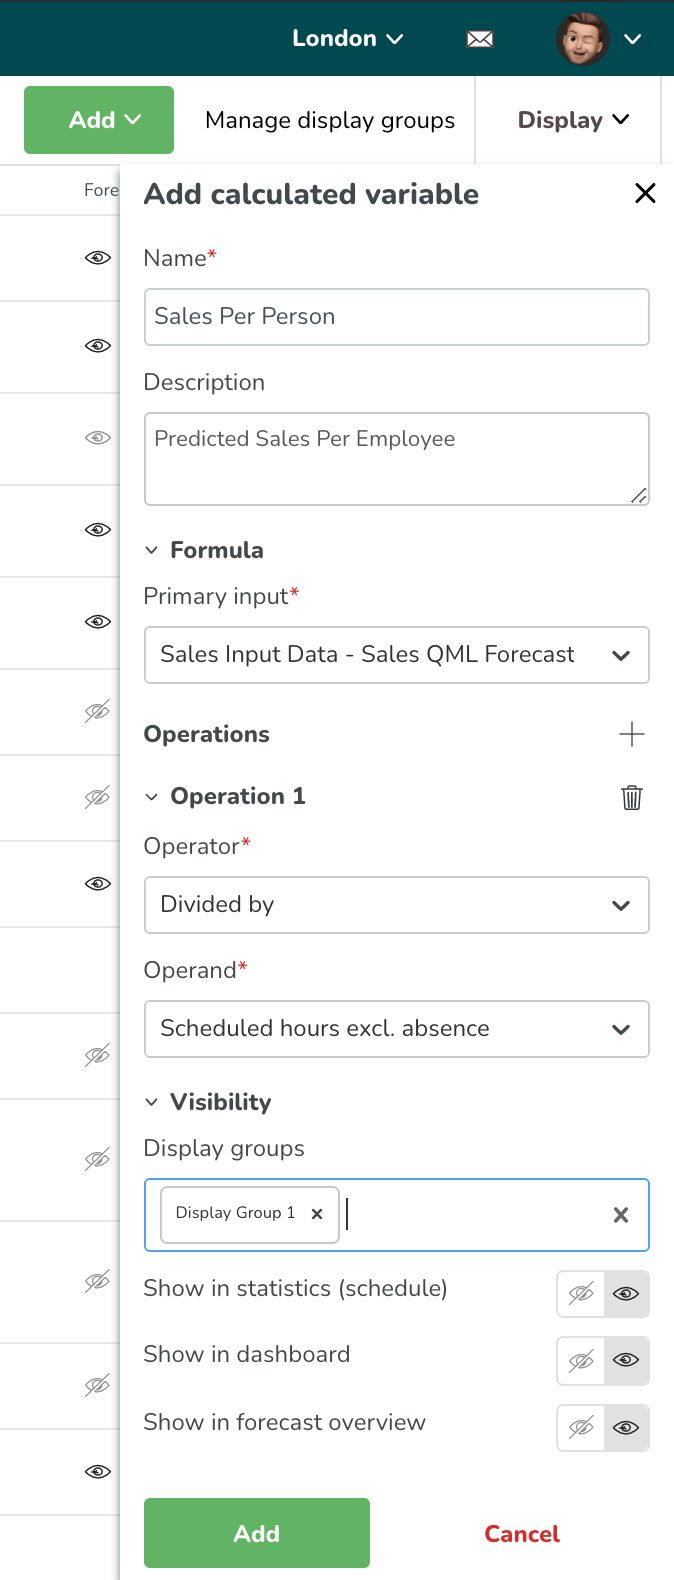
Example of a calculated variable
Predicted sales per scheduled person hour is a commonly used KPI within many verticals.
To create such a variable, you must have Neo Forecast activated and configured in order to have a predicted sales value. Quinyx can auto-generate this prediction using AI - with your organization providing the actual sales.
To add that variable, in the Add new variable dialogue, select:
- Primary Input: Predicted sales.
- Operator: Divided by.
- Secondary input: Scheduled hours.
In this example, we want them to be visible in schedule statistics, forecast overview, and dashboard:
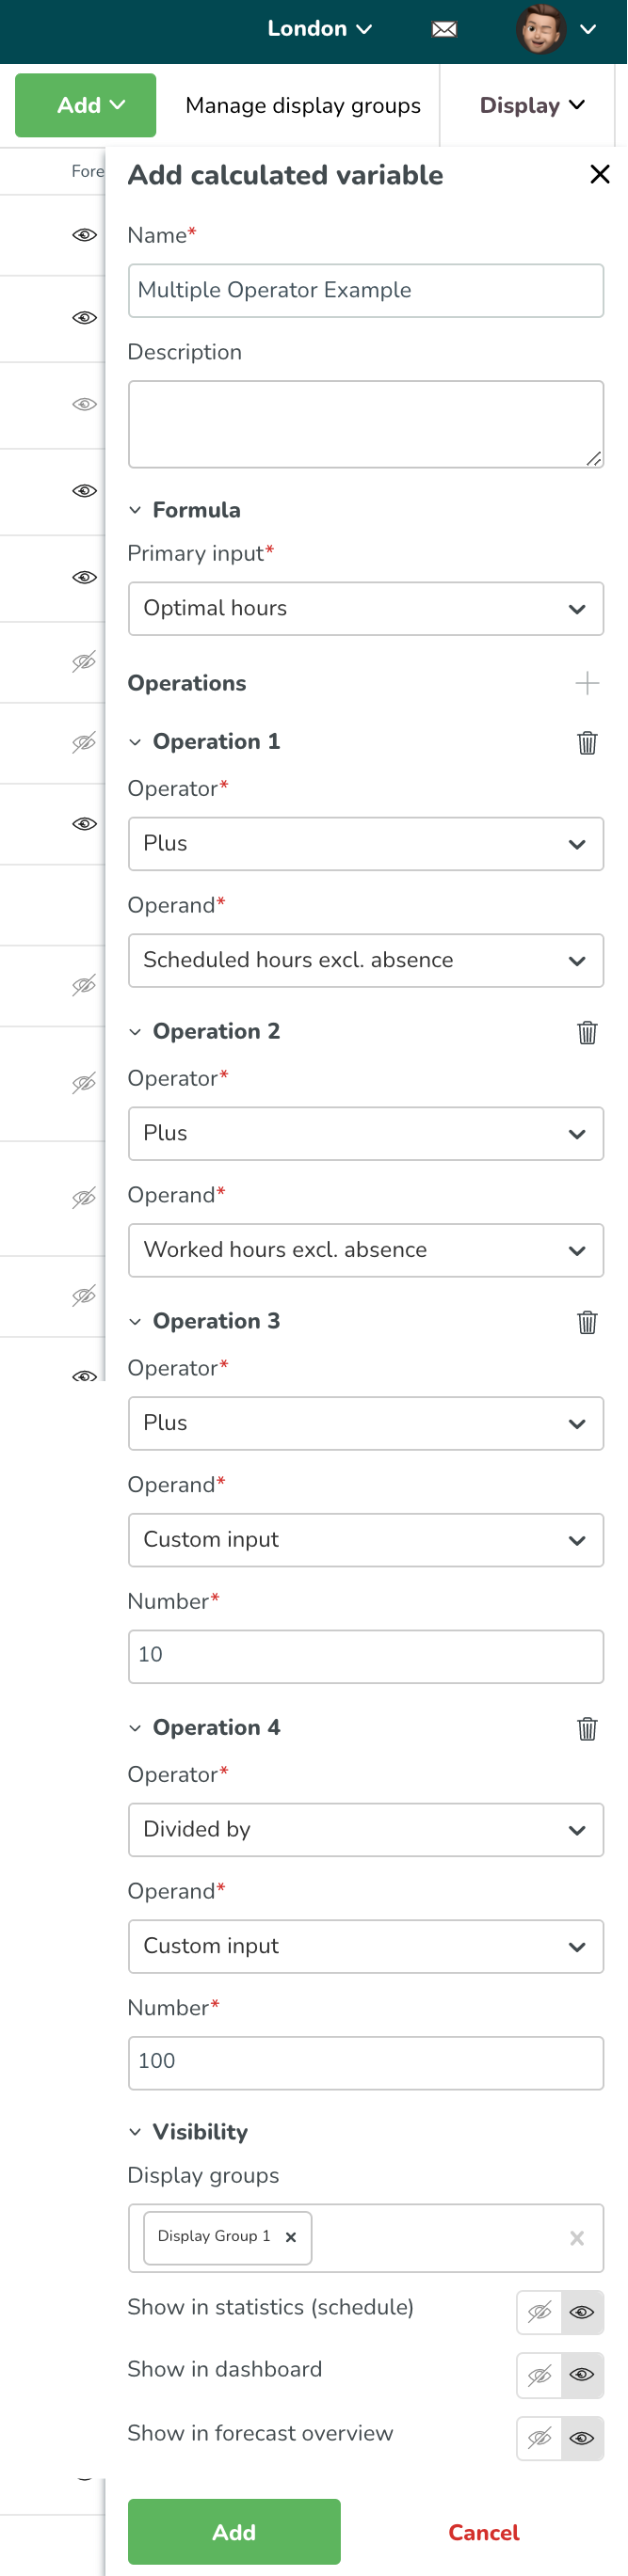
Example of a multiple operator calculated variable
We will use this wild example to show how multiple operations are calculated.
The calculation will be performed where the totals of each operation will be used in the following operation, using the screenshot example below, the calculation will be performed like this:
Optimal Hours + Scheduled Hours = x
x + Worked Hours = y
y + Custom input = z
z / custom input = output displayed in the GUI
Calculated variables based on a calculated variable
Quinyx allows calculated variables to be created based on other calculated variables. That means that if you, for example, want to create a calculated variable that takes the sum of your forecast configuration variables and divides that by scheduled hours, you now can create two calculated variables:
- Calculated variable 1 (total items sold) = items sold Coffee + items sold Sandwiches + items sold Cold Beverages
- Calculated variable 2 (total items sold/scheduled hours) = calculated variable 1 (total items sold) / scheduled hours
Considerations
- You can now include a calculated variable either in the primary input or in the operands of another calculated variable.
- Quinyx only allows for calculated variables to be based on maximum one other calculated variable, either as primary input or as operands.
- We still have a maximum of 4 operands within a calculated variable.
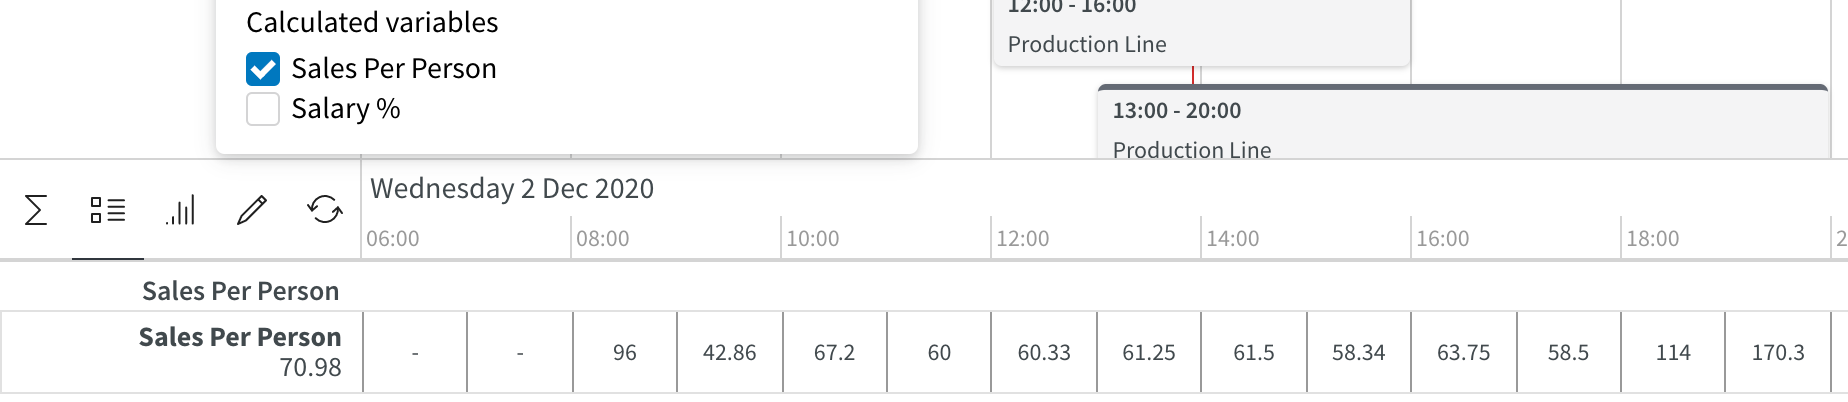
View calculated variables in schedule - Statistics
You can select a calculated variable to be viewed in statistics. Visibility settings are done on an organizational level, meaning that all variables might not be used or configured to be viewed by your organization.
Read more about Statistics.
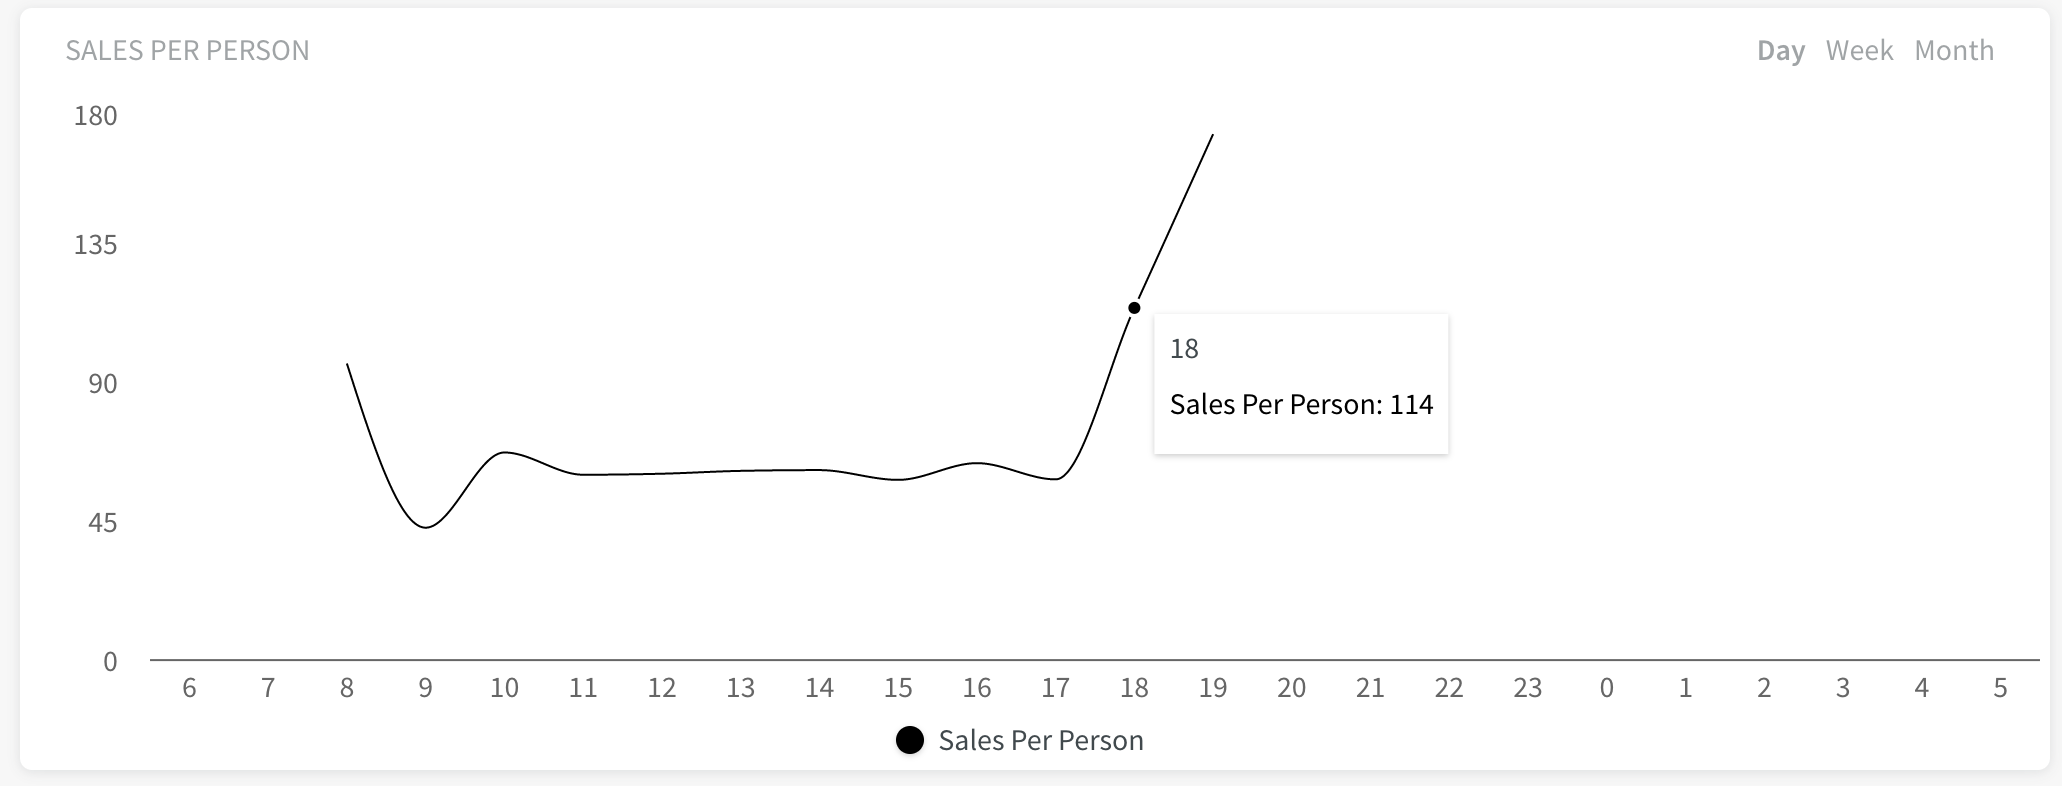
View calculated variables in the Dashboard
A calculated variable will have a separate graph in the Quinyx dashboard. It will still have the options for selecting current day, current week, and current month - the same way the existing widgets are in the dashboard today
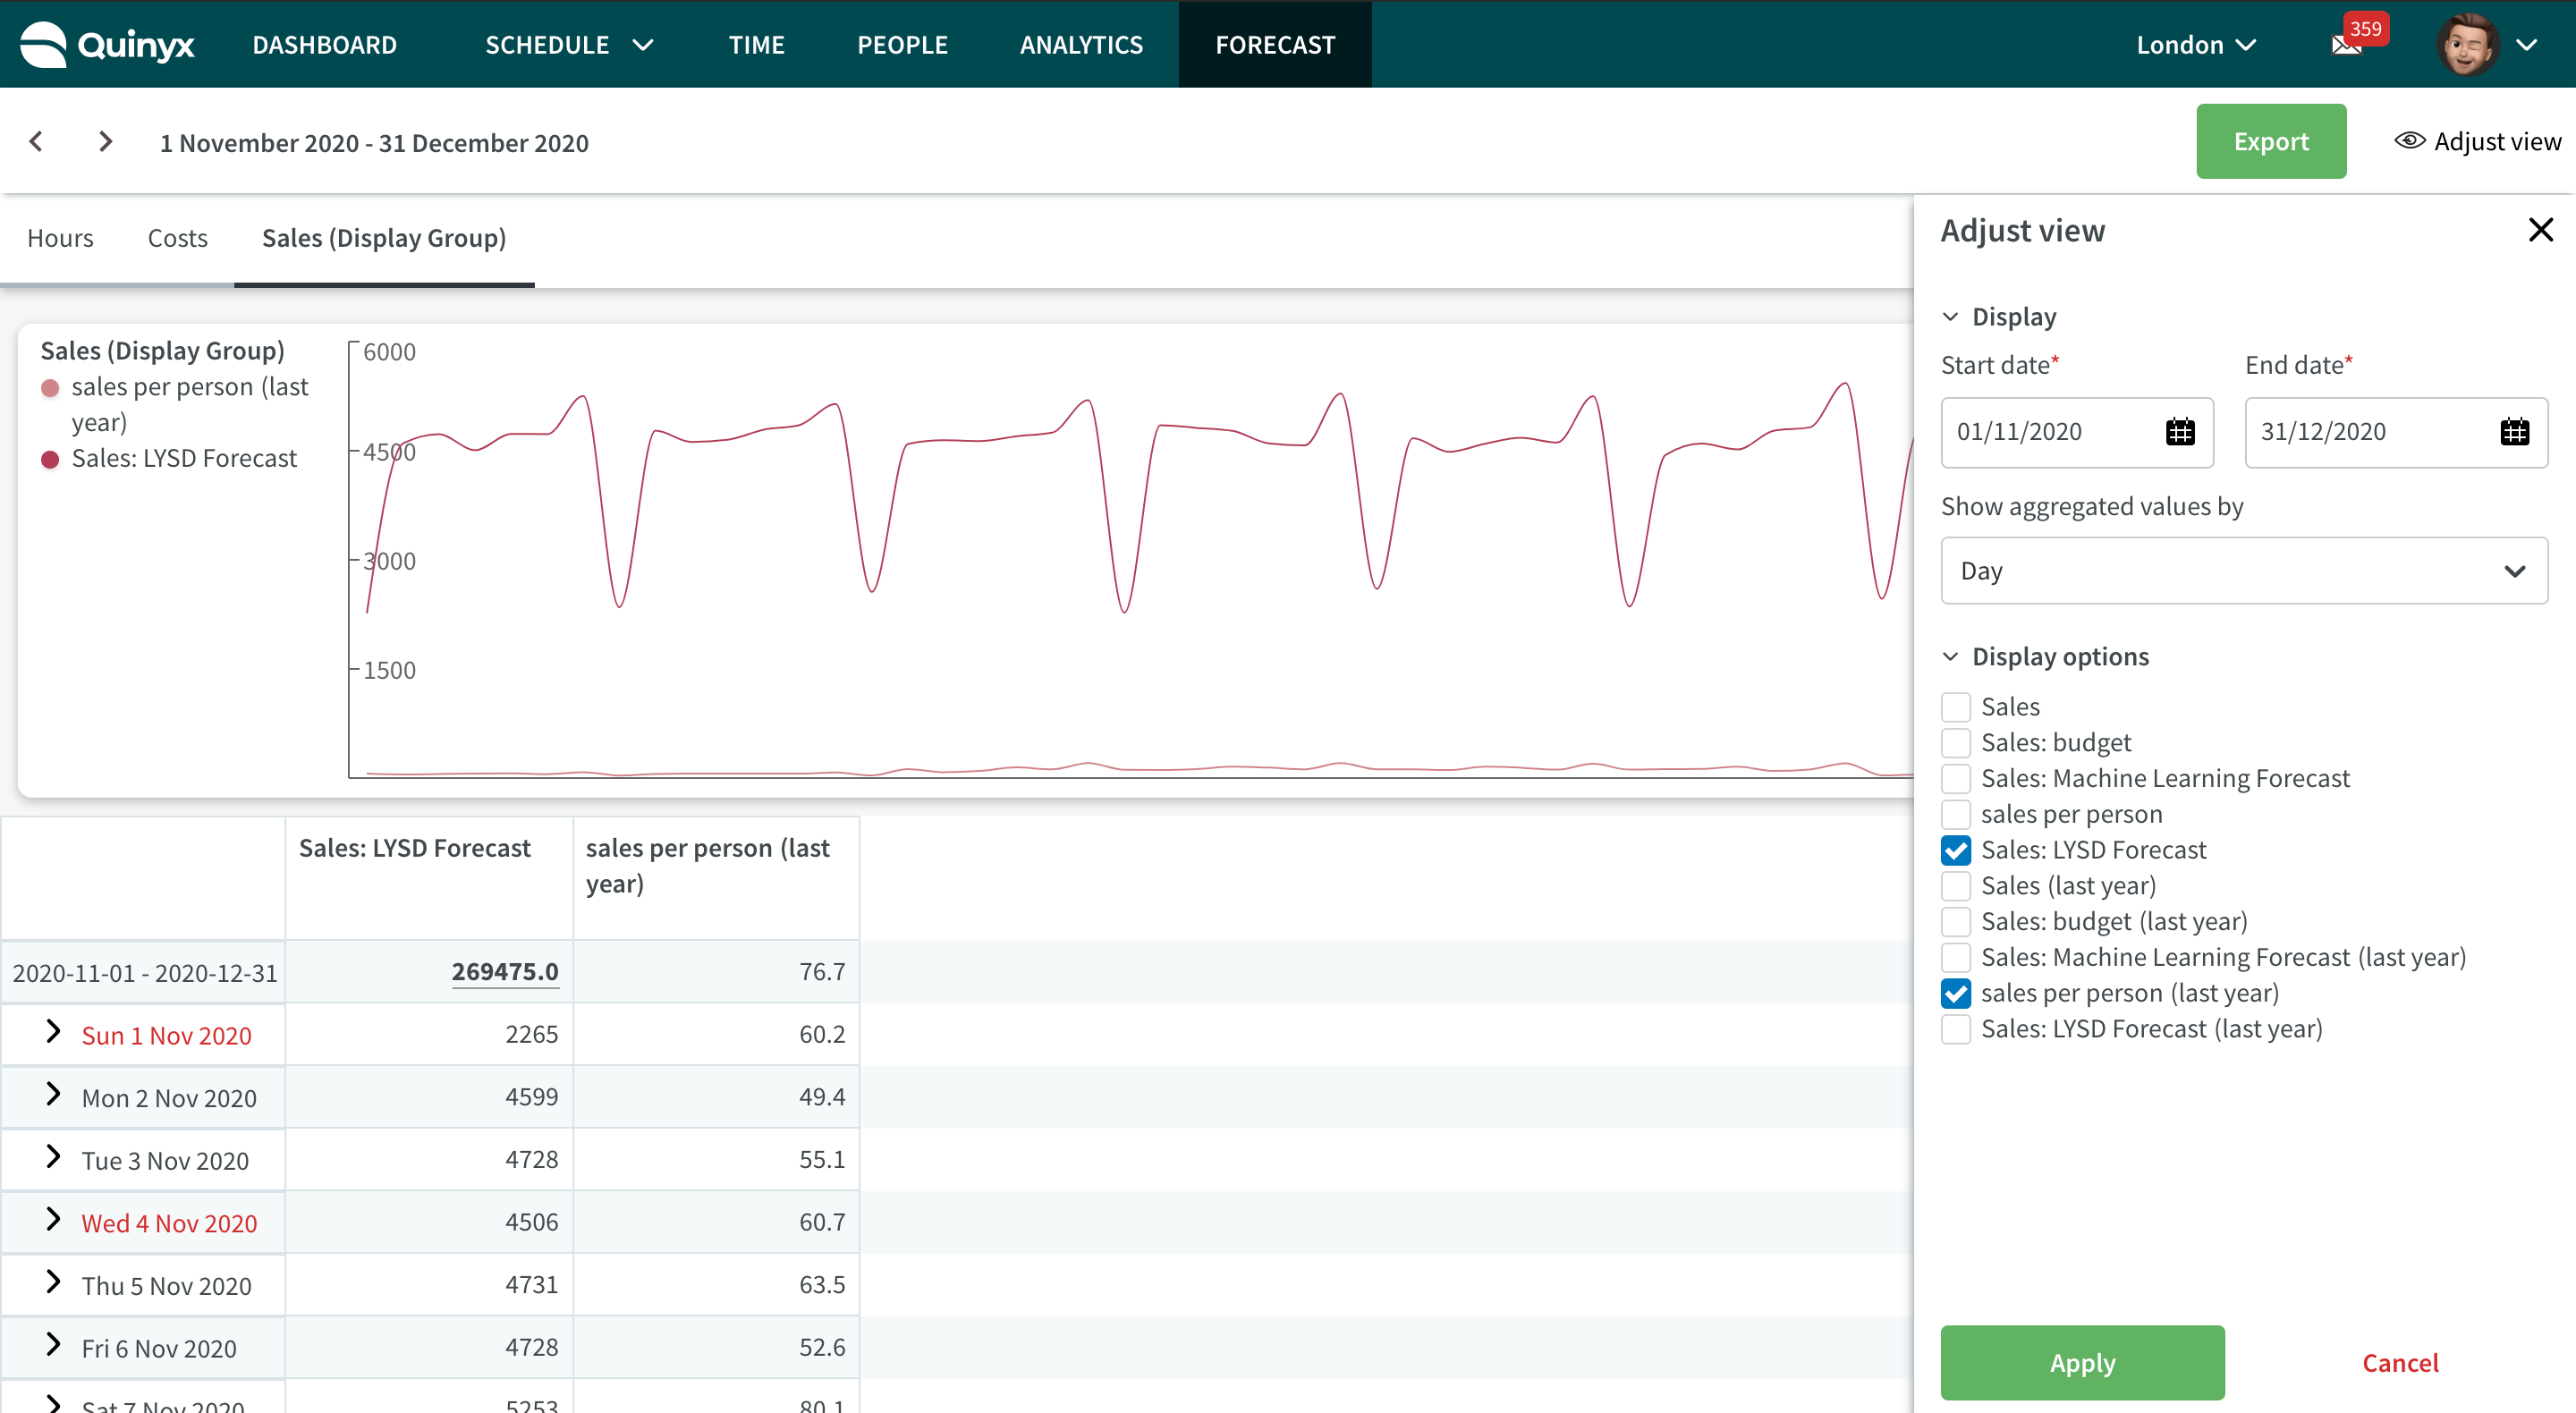
View calculated variables in the Forecast Overview
The calculated variable must be added to a display group in order to show in the forecast overview page.