Compliance Checker
 Updated
by
Leigh Hutchens
Updated
by
Leigh Hutchens
What is the Compliance checker?
Advanced Analytics: Compliance is a key component within the Quinyx platform, designed to ensure that workforce scheduling meets the specific compliance standards set by our customers. The compliance checks are strategically distributed across Mondays and Tuesdays to manage the significant volume of data and API calls. This approach allows for a balanced workload and efficient data processing.
The Compliance Checker is a practical tool that provides Quinyx users with immediate insights into scheduling adherence. It flags any non-compliance by comparing schedules against customer-defined rules, highlighting discrepancies with details such as unit, employee ID, employee name, rule name, and the date of the violation. Its interactive design enables users to filter results by clicking on elements within the tables, focusing on particular rules, units, employees, or dates for a more targeted review.
Advanced Analytics: Compliance is not just a monitoring tool; it's a platform for strategic decision-making, aimed at giving users a comprehensive view of their compliance landscape. Each Quinyx tenant benefits from a tailored Compliance feature, set up in collaboration with our team to reflect their unique rules and requirements, all managed through our analytics GitHub space.

Usage Tips:
- Utilize the filter options at the top of the dashboard to segment the data by specific districts, units, or employees for focused analysis.
- Use the Time Granularity filter to adjust the view between daily, weekly, or monthly reports to match your monitoring needs.
- Hover over chart elements to get more detailed data tooltips for in-depth analysis.
- Review the Number of Violations regularly to identify any patterns of non-compliance and address them with targeted training or policy revisions.
Dashboards
Advanced Analytics: Compliance is split into three sections: Organizational, District, and Unit.
The module features Compliance violations for scheduled and worked hours. Scheduled hours show how your organization is performing in their schedule compliance by looking at shifts in the schedule individually and for a longer period of time-related to the labor laws configured for the unit and employee. Worked hours interpret the punches in Quinyx and check for any worked violations in the schedule to validate that they were done according to configured labor laws and preferences.
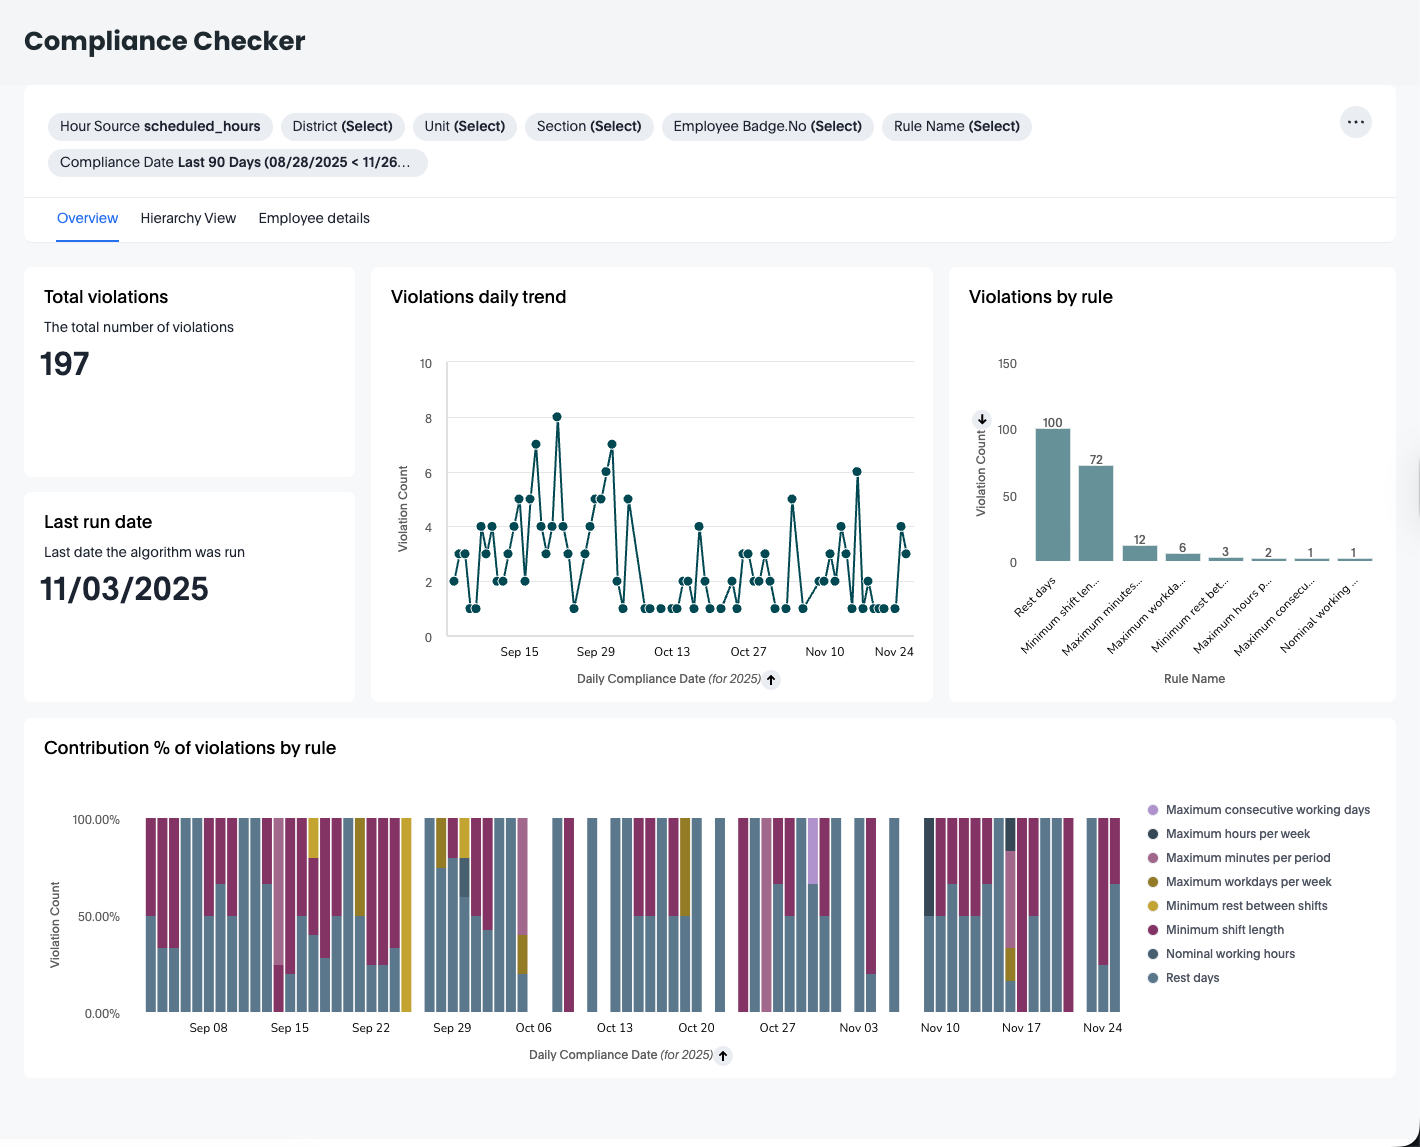
Overview tab
This section provides a comprehensive view of your organization's overall compliance health, detailing all recorded violations. The extent of the data displayed is determined by your position within the organizational hierarchy and any active filters. To obtain a complete overview of the organization, ensure you navigate to the top level of the hierarchy.
Dashboard item | What it does |
Total Number of Violations | This figure provides an at-a-glance view of the total compliance violations recorded within the system. It aggregates all instances where company-set rules were not followed, giving you a broad indicator of overall compliance.  |
Algorithm - Last Run Date | Located directly beneath the total violations count, this date signifies when the compliance algorithm was last executed to update the dashboard data. It ensures you're looking at the most recent information.  |
Violations daily trend (Time Series Graph) | The line graph displays trends in compliance violations over time. By observing the peaks and troughs, you can identify patterns, such as recurring issues that may require targeted interventions. 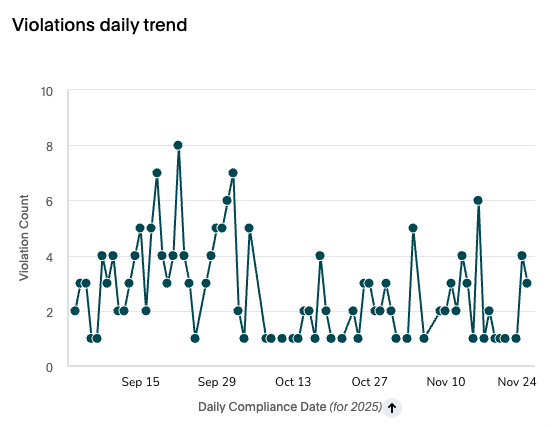 |
Violations by rule (Bar Chart) | This horizontal bar chart breaks down violations by specific rules. It allows you to quickly see which rules are most frequently violated and may need more attention or clarification for your staff. 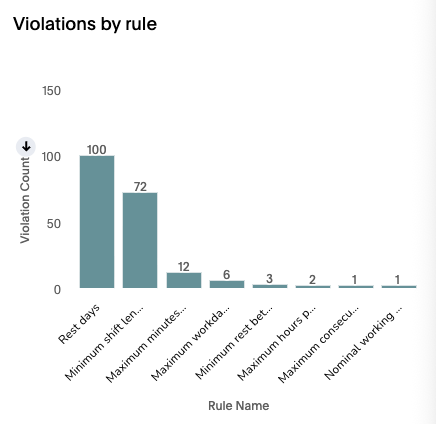 Total number of violations per rule. The columns are sorted in descending order based on the Total no. of Violations. You can select up to 5 rules at the same time. |
Contribution % of Violations by rule (Stacked Bar Chart) | The stacked bar chart offers a visual representation of which rules contribute most to the violations over time. Each color represents a different rule, illustrating the relative weight of each rule's violations. 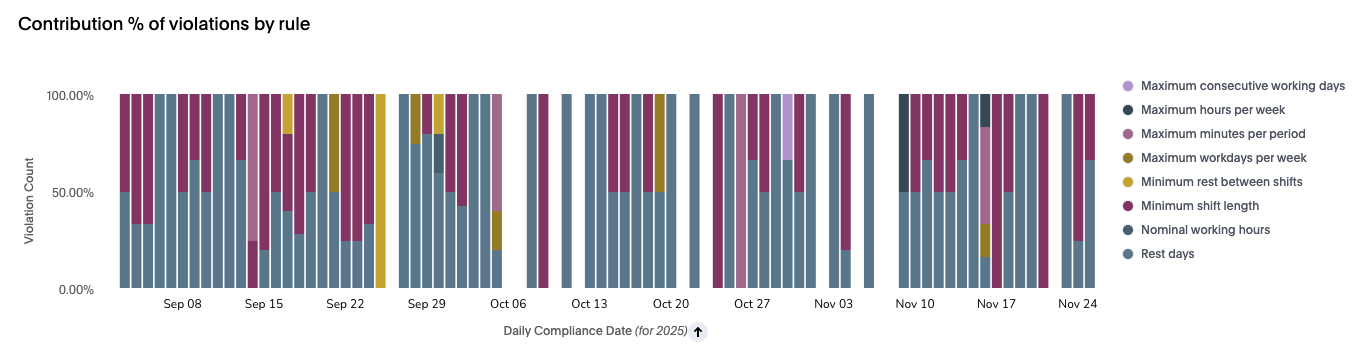 |
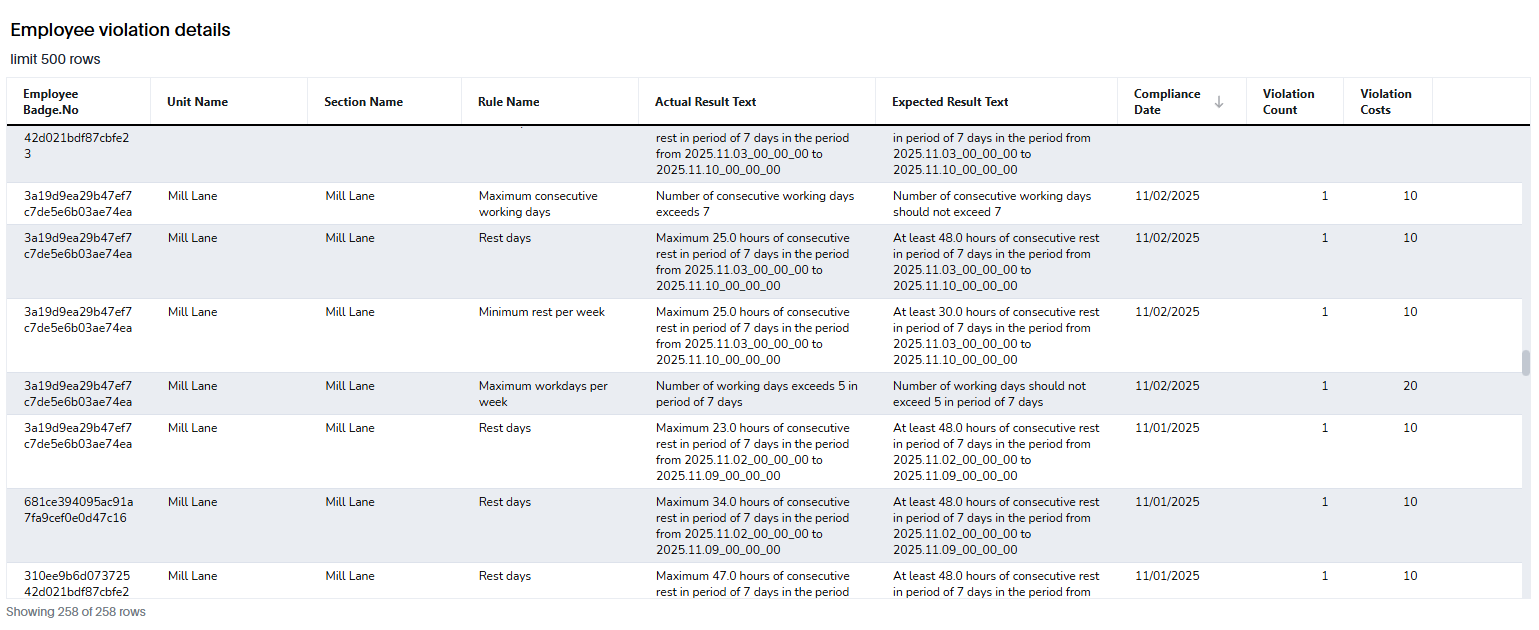
Employee violation details (Table) | The table section provides detailed records of individual employee violations. Here you can review which employees are violating specific rules, see the actual versus expected results, and understand the context of each incident based on the recorded date. This information is crucial for addressing individual cases and for having informed discussions with employees about their compliance performance. 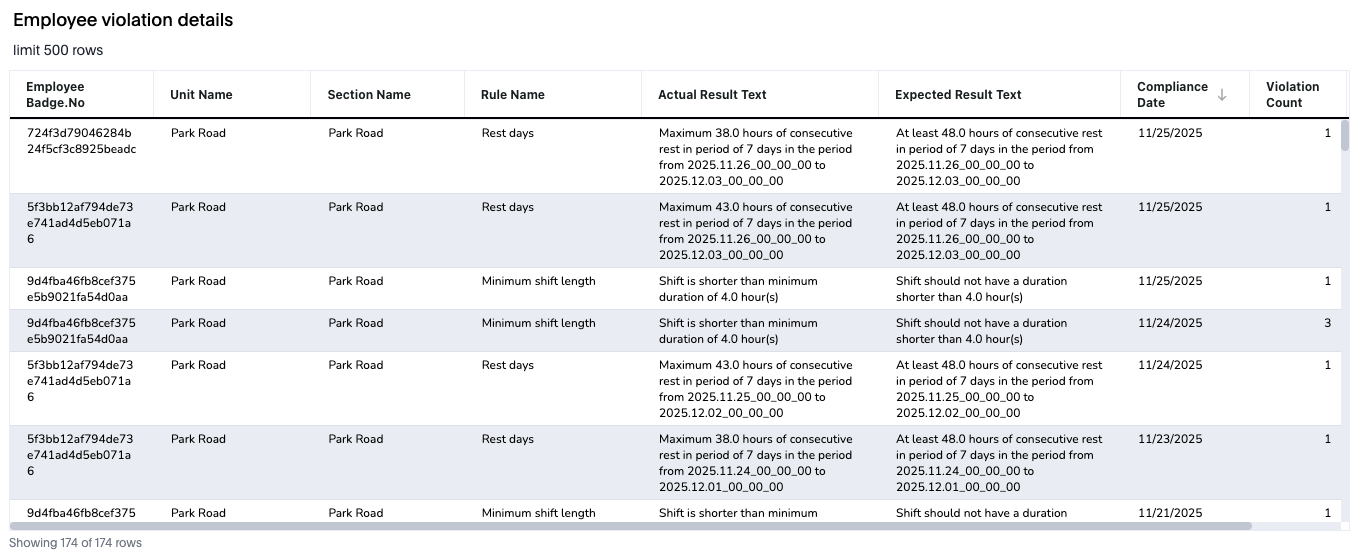 |
Fields in the Organization view
Field | Example | Description |
Badge Number | 123456789 | Unique badge number/identifier for the employee for whom the violation occurred. |
Employee name | John Smith | Name for the employee as configured in Quinyx. |
Unit | Broadway North | Name of the unit of which the violation occurs. |
Rule name | Maximum Hours Per Day | Name of the rule or the custom name of the rule configured for the violation. |
Actual Result | No period of X hours of consecutive rest in the period of Y days. | Explanation of the outcome (why the rule was violated) which relates to existing settings in the rule or on agreement for the employee. |
Expected Result | At least X hours of consecutive rest in period of Y days. | The expected schedule for adhering to compliance rules, in relation to Actual Result, it can be used to understand what the output should be. |
Date | 2024-03-12 | Date for when the shift, of which a violation relates to, is planned. |
Total Violations | 1 | Amount of violations for the specific rule, employee, and unit on that specific date. |
Hierarchy Comparison & Drill-down tab
A section specifically for dividing violations across the districts to get insights into the unique District and Unit Compliance. Again, making use of the interactivity, you can filter for a specific unit or district by clicking the selection you want to filter for.
Dashboard item | What it does |
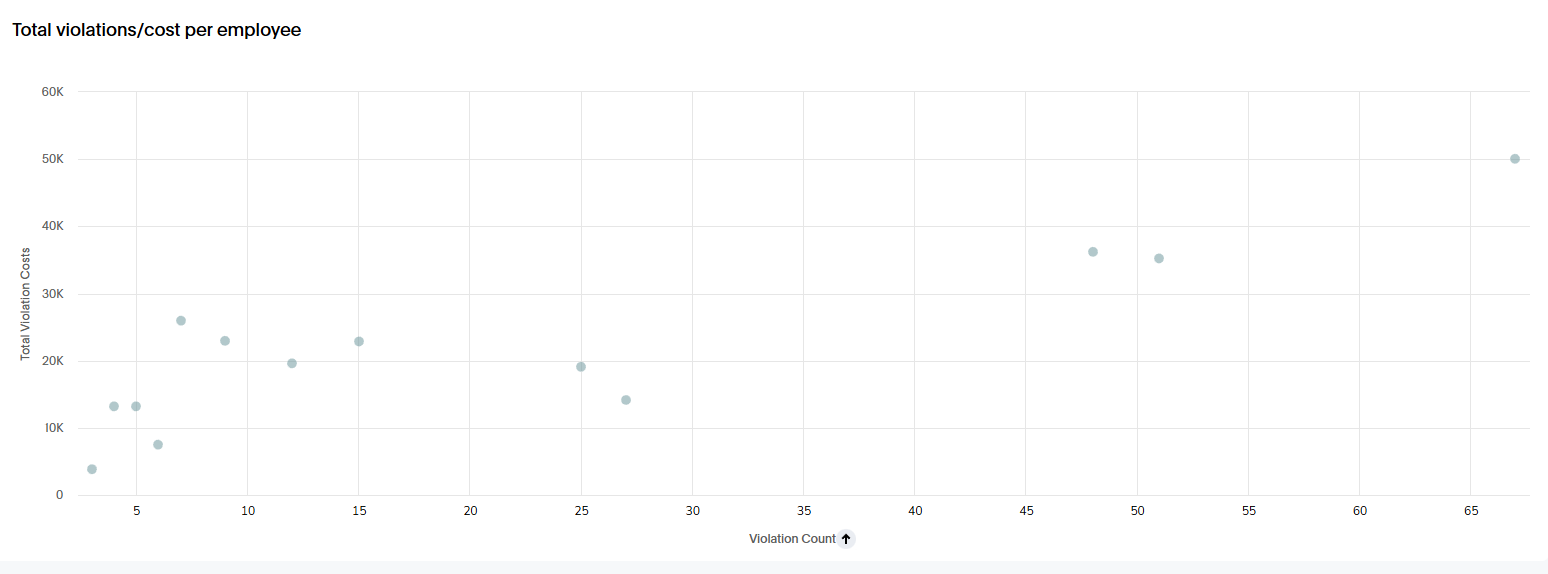
Total violations & cost - District/ Unit/ Section (Scatter plot) | This scatter plot compares the number of violations across various districts and the cost of said violations. The x-axis represents the number of violations, while the y-axis shows the cost of violations. This visual is particularly useful for quickly identifying which districts may require additional training or oversight. This scatter plot exists for the unit and section level as well, for a more detailed insight. 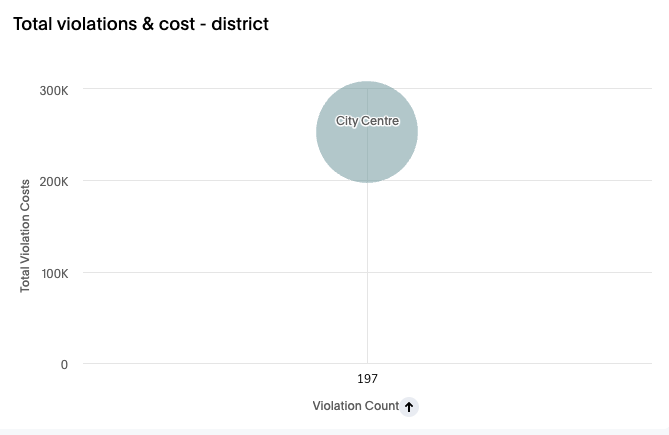 |
Total violations over time - District/ Unit/ Section (Line Chart) | The line chart offers a detailed temporal view of violations across districts. It's plotted with time on the x-axis and the number of violations on the y-axis. This chart is instrumental in tracking the effectiveness of any corrective actions taken within districts over time. This line chart can be used at the unit and section level as well. 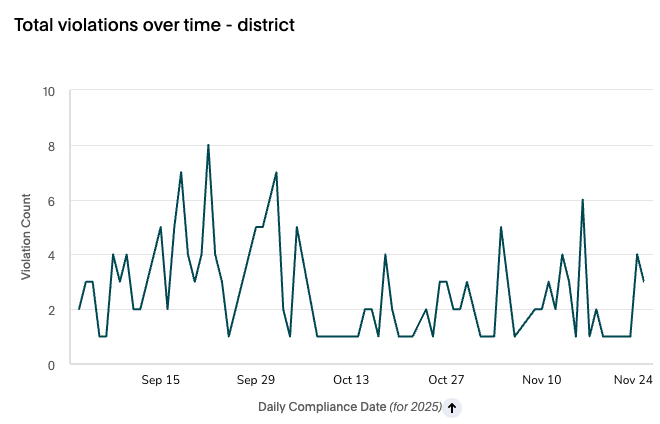 |
Violations hierarchy overview (Table) | Below the graphs, you'll find a table that lists the number of violations for each rule within a district, unit, or section. This detailed breakdown can help in pinpointing specific areas of non-compliance and is crucial for developing targeted strategies to improve adherence to company policies. 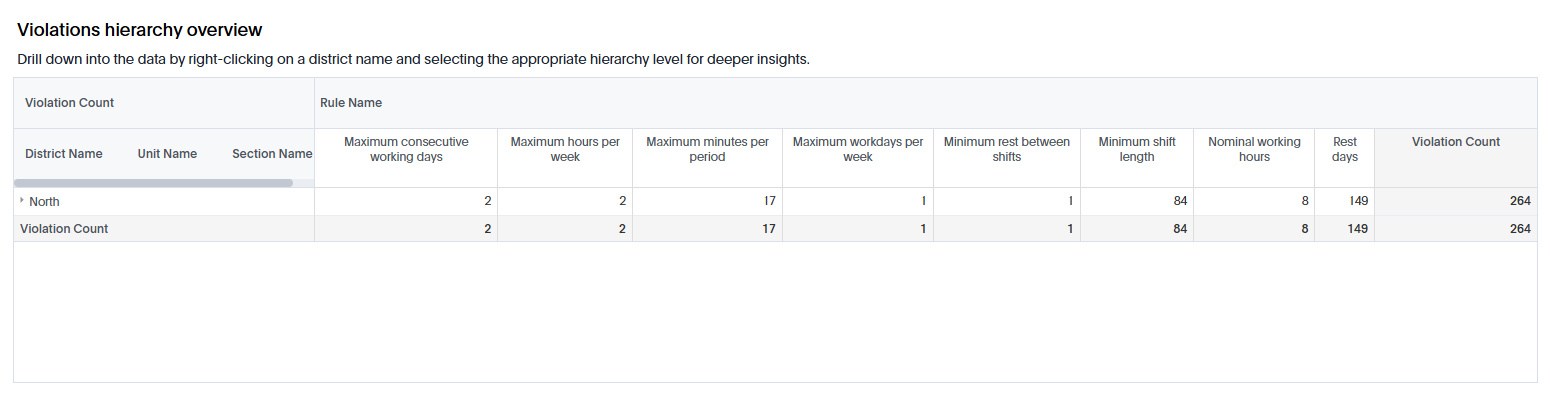 |
Fields in the District view
Field | Example | Description |
District | North | District name for where violations occur |
Rule name | Maximum Hours Per Day | Name of the rule or the custom name of the rule configured for the violation. |
Total Violations | 12 | Amount of violations for the specific District for each Rule. |
Fields in the Unit view
Field | Example | Description |
Unit | Broadway North | Name of the unit of which the violation occurs. |
Rule name | Maximum Hours Per Day | Name of the rule or the custom name of the rule configured for the violation. |
Total Violations | 12 | Amount of violations for the specific Unit for each Rule. |
Employee details tab
The Employee details view in the compliance checker provides a detailed, employee-level breakdown of all compliance violations detected within the selected time frame. This view helps organisations understand who is violating compliance rules, how often, why, and what those violations cost.
Dashboard item | What it does |
Employee violation details | The main component of the tab is a detailed table that lists every recorded violation per employee. Each row represents a single violation instance. Columns included in the table are:
 |
Total violations/ cost per employee | The scatter (bubble) chart visualises:
This visual allows users to quickly identify:
 |