Dashboard
 Updated
by
Leigh Hutchens
Updated
by
Leigh Hutchens
Why the Dashboard is useful
The Dashboard serves as your central command center for workforce management, offering significant benefits that enhance operational efficiency and decision-making. By consolidating critical information into a single, customizable view, the Dashboard enables managers to:
- Save time: Access all essential workforce data in one location, eliminating the need to navigate through multiple screens and modules
- Make proactive decisions: Spot potential staffing issues, coverage gaps, and upcoming events before they become problems
- Improve response times: Quickly identify and address pending requests, approvals, and scheduling conflicts with direct links to relevant sections
- Enhance visibility: Gain real-time insights into staffing levels, shift coverage percentages, and upcoming workforce needs across different organizational levels
- Streamline workflows: Use integrated navigation to move seamlessly from dashboard insights to actionable tasks in the Schedule view
Whether you're managing a single unit or overseeing multiple districts, the Dashboard adapts to your scope of responsibility, ensuring you always have the right information to maintain optimal workforce performance and employee satisfaction.
Easily access information about events, staffing, and scheduling. Depending on your selection in the group selector, it will display the relevant data for your district, unit, or section.
Default Dashboard widgets
The default Dashboard widgets are:
Widget name | Primary function |
Summary of Location | Key performance indicators (KPIs) showing scheduled employees, hours, unassigned shifts, and shift coverage for the selected period. |
Today's Overview | A real-time snapshot of employee attendance, including late arrivals, no-shows, and current absences. |
Needs Attention | A prioritized overview of operational follow-ups (e.g., approvals and upcoming events). |
Staffing | A comparison chart of scheduled hours versus actual worked (punched) hours for the current day, week, or month. |
Needs Approval | A consolidated view of requests requiring manager approval (e.g., absence requests and shift bookings) and immediate coverage gaps. |
Shift Coverage | A visual representation of all shifts and assigned shifts. |
Summary of Location
In Summany of Location, managers can quickly understand the current scheduling status and see where action might be needed.
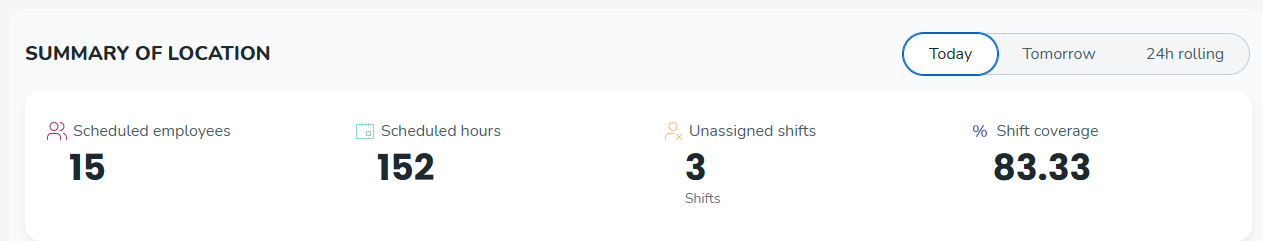
- Scheduled employees: The scheduled employees KPI shows the number of employees scheduled to work on the current day, the day after, or within a 24-hour period.
- Scheduled hours: The scheduled hours KPI shows the number of scheduled hours on the current day, the day after, or within a 24-hour period.
- Unassigned shifts: The unassigned shifts KPI shows the number of unassigned shifts within the current day, the day after, or within a 24-hour period. This KPI can be used as an indicator of how many shifts need to be filled.
- Shift coverage: The shift coverage KPI indicates the percentage of shifts with assigned employees compared to the number of unassigned shifts within the current day, the day after, or within a 24-hour period. This KPI will help you to quickly understand the percentage of the shifts that need to be filled.
Today's Overview
Today's Overview provides a real-time snapshot of attendance that gives you an immediate sense of how the day is shaping up. Instead of checking multiple places to understand who’s starting soon, who’s already on site, who’s late, or who hasn’t shown up, you get all of it directly on the Dashboard.
It’s the view you open first thing in the morning and revisit throughout the day to make sure you have the coverage you need. If someone arrives late, misses a punch, or an absence creates a staffing gap, you’ll see it right away. That makes it much easier to take action - reassign a shift, arrange cover, or handle potential issues before they grow.
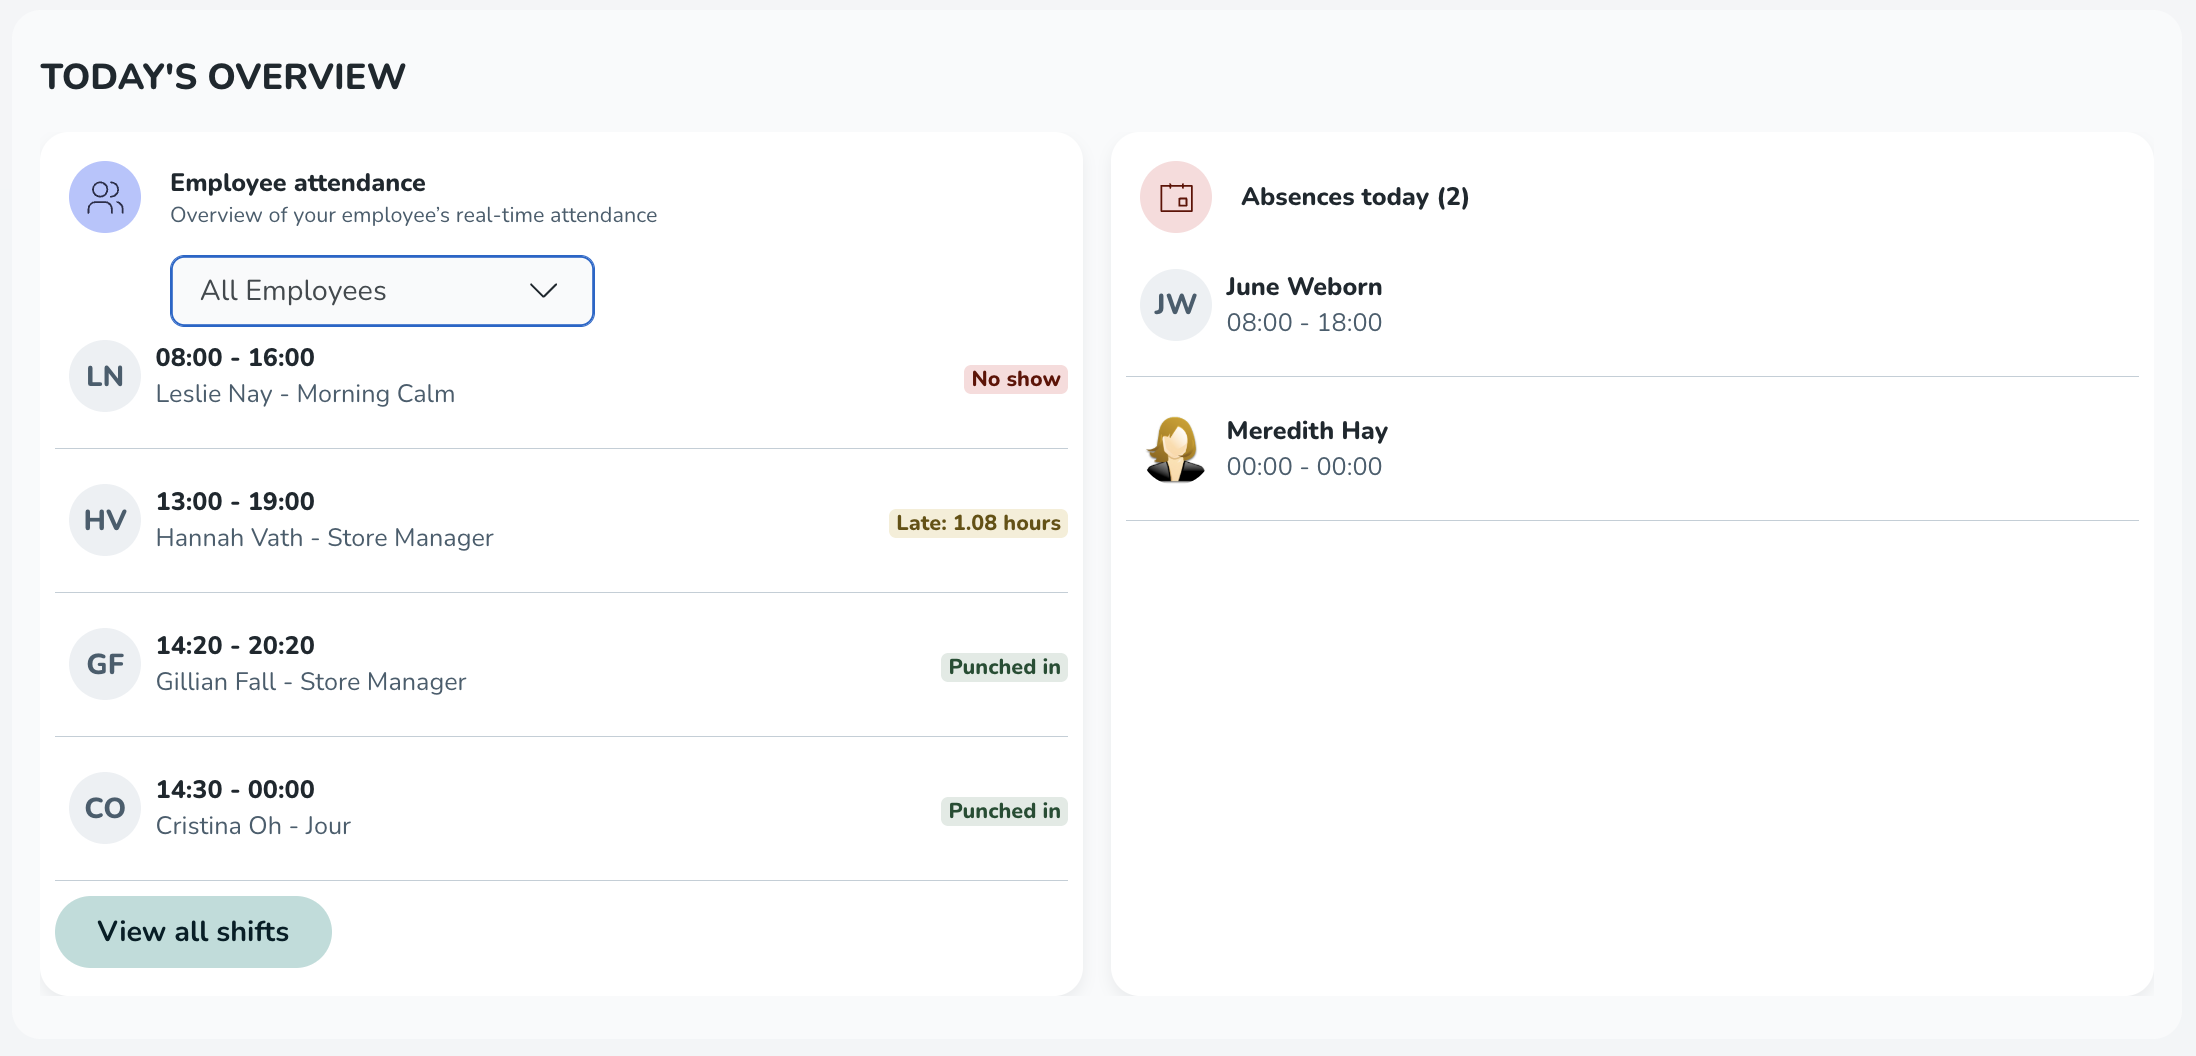
Today’s Overview consists of two parts: Employee attendance and Absences today.
Employee attendance
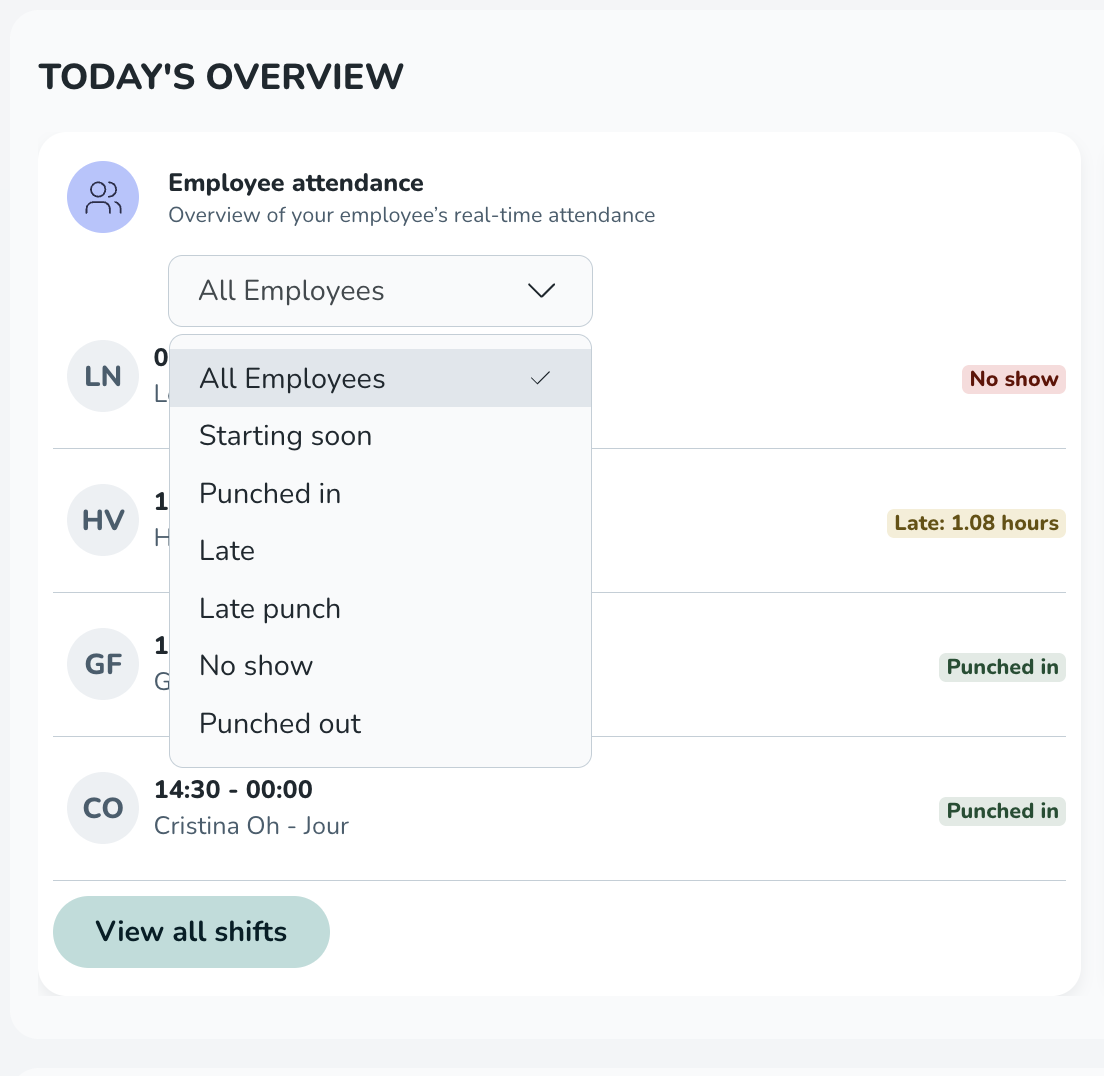
This section shows employees with shifts or punches within a 4-hour window (current time ± 2 hours). The list is sorted by the shift start time (or punch start time when no shift exists). When relevant, each row includes a status label.
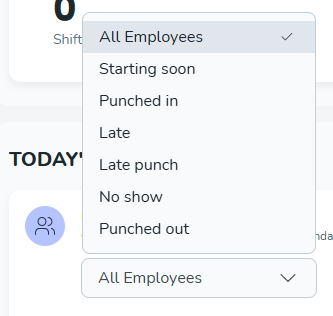
Status label | When it appears |
Starting soon | Shows 15 min before shift start. |
Punched in | Active punch exists. |
Late | No punch within 0–60 minutes after shift start. |
Late punch | Employee punched in after shift start time, [time] shows the time between the shift start and the punch start. |
No show | Still not punched in >1h after shift start. |
Punched out | Early punch-out before the end of the shift. |
You can filter the list using the status filter above the items. Selecting all employees will show the full list.
Lastly, you can also go directly to today’s schedule by clicking on View all shifts.
Special time-reporting cases
- Punching without schedule: Punches appear in the list as long as the punch exists. The punch start time determines its position in the list.
- Deviation reporting: Only Punched in or Starting soon statuses are shown.
- Punching in/out and breaks: If an employee is punched out on a break, they are still shown as punched in. In this first version, the widget only considers the start and end times of punches.
Absences today
This section shows all approved absences for today between 00:00–23:59.
Good to know about Today’s Overview
- Widget data: The widget reflects all data available in the unit or section you are viewing. Shared employees working in that unit or section will appear if applicable.
- Data refresh:
- Punch data refreshes automatically every 5 minutes.
- Shift data refreshes every 3 hours.
- Reloading the page always shows the latest available information.
- Permissions: You need at least read access to Scheduling to view the widget. To see each section:
- Employee attendance: Scheduling → Punches (≥ read).
- Absences today: Scheduling → Absences (≥ read).
- Visibility: The widget is visible on desktop, mobile, or tablet.
- Dashboard user: The widget will be available on a unit and section level Dashboard.
Needs Attention
The Needs Attention widget helps you identify and act on the most important operational follow-ups for the coming weeks. It replaces the previous "Upcoming events" widget to provide a more streamlined, actionable experience.
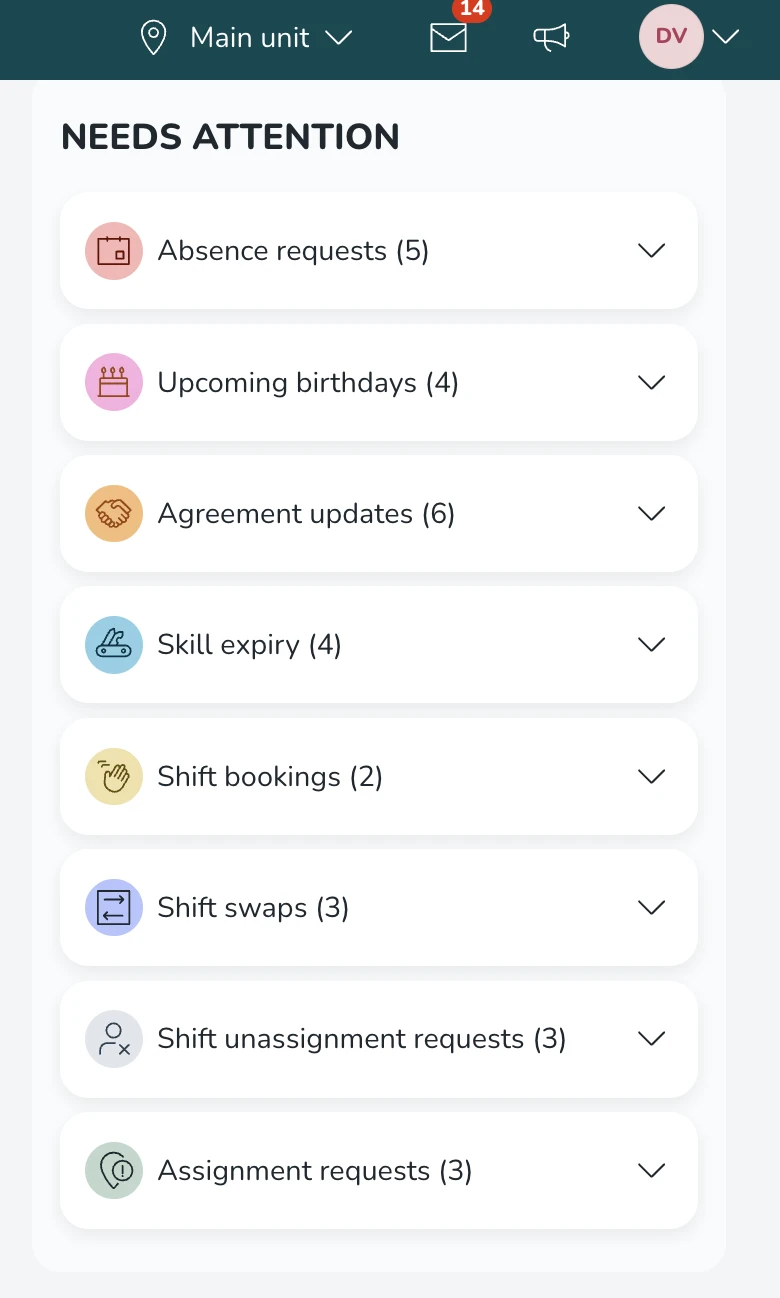
What’s included
The widget displays items occurring within the next 28 days. Depending on your permissions, you may see:
- Requests: Absence, shift unassignment, shift bookings, shift swaps, and assignment requests.
- Agreements: Upcoming agreement updates and expiring agreements.
- Employee Info: Birthdays and skill expiries.
General behavior
- Collapsible Lists: Sections are displayed as "accordions." They are collapsed by default to save space, showing a title and the count of items.
- Scrollable Views: Most sections show up to five items; you can scroll to see the rest.
- Refresh: The widget refreshes whenever the Dashboard reloads.
Interactions
You can take action directly from the widget:
- Deep-linking: Selecting any request-based item (e.g., an absence or shift swap request) opens the Schedule tab with the Notifications panel automatically focused on that specific request.
- Information only: Items like Birthdays, Skill expiries, and Agreement updates are for visibility and do not trigger a redirect when clicked.
Visibility & Permissions
This widget is visible on the Local Manager and Section Manager Dashboards. If you lack permission for a specific section (e.g., Skill expiries), that section is hidden. If you lack permissions for all sections, a "No permission" message is displayed.
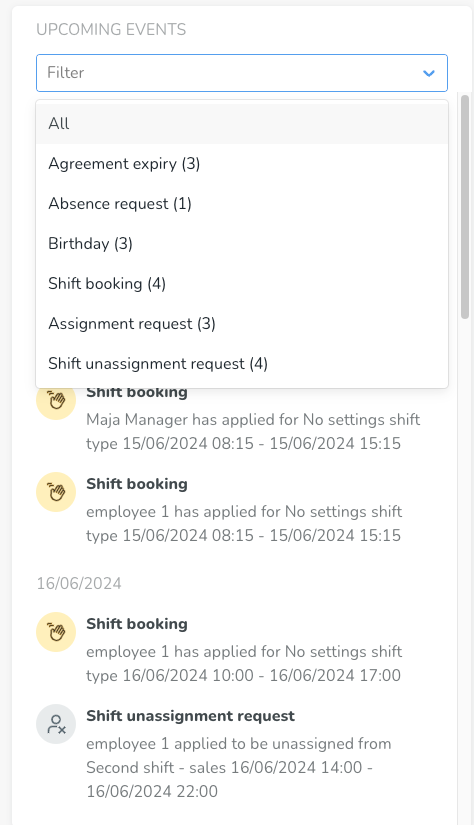
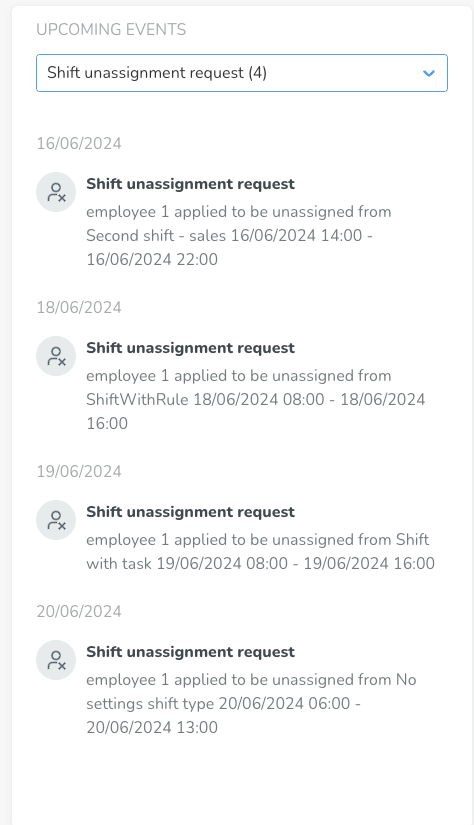
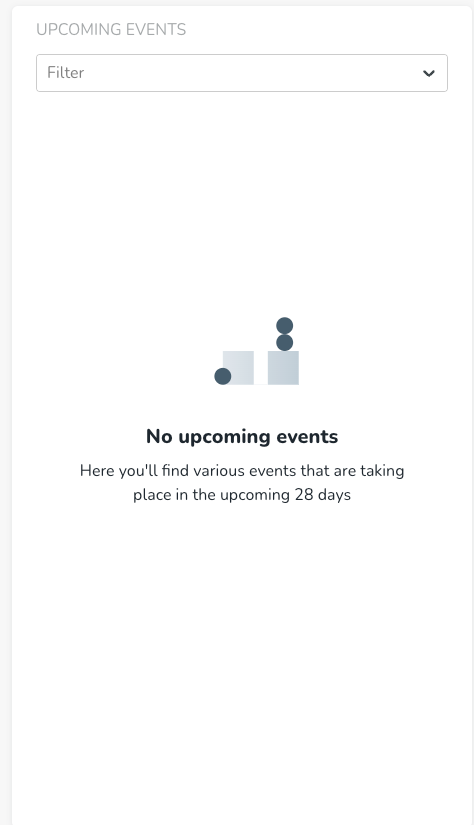
Filtering upcoming events in the Dashboard
You can interact with the Upcoming events section by filtering out the events you want to see. In addition, you can also see the number of events for each group of events.
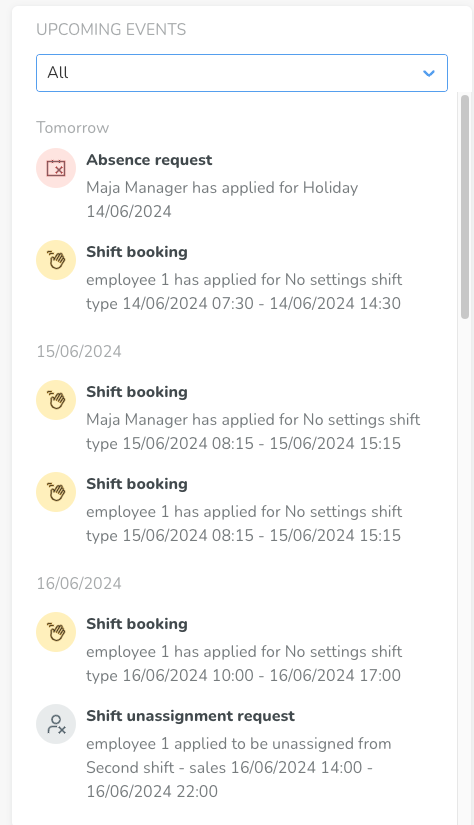
If there are no upcoming events, the page will display an empty state similar to the example below.
Staffing
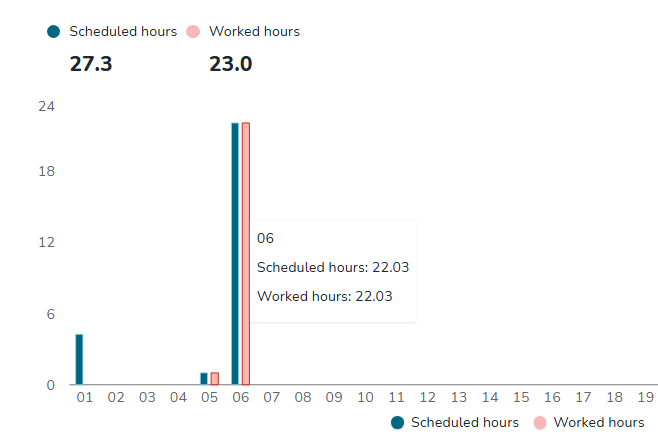
This widget is set to display data for the current day, week, or month. The widget contains a chart displaying scheduled hours in relation to worked hours. Selecting the daily view will show the amount of scheduled and punched hours grouped by hour of the day. Selecting the weekly or monthly view will show the same data but grouped by day of the week or month, respectively.
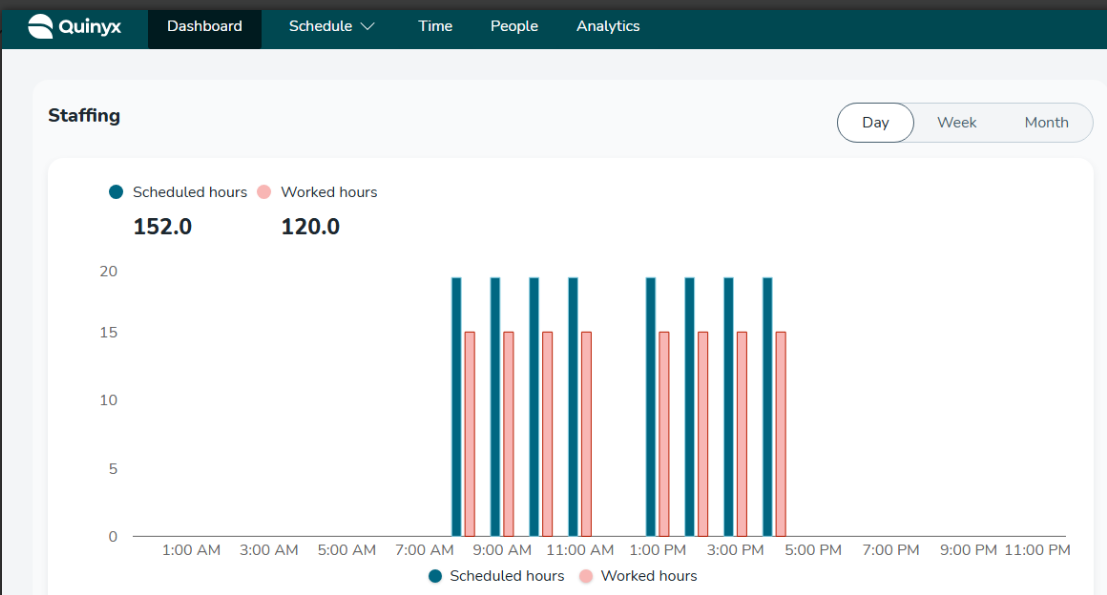
Hovering over a bar in the chart will display the number of scheduled vs. worked hours for that hour or day.
Within the Staffing graph, you can see the specific dates for the selected period. Clicking on any of the graph bars will redirect you to the Schedule view for that specific day, week, or month.
Scheduling
These widgets contain scheduling-related information and display data for the coming four weeks (28 days).
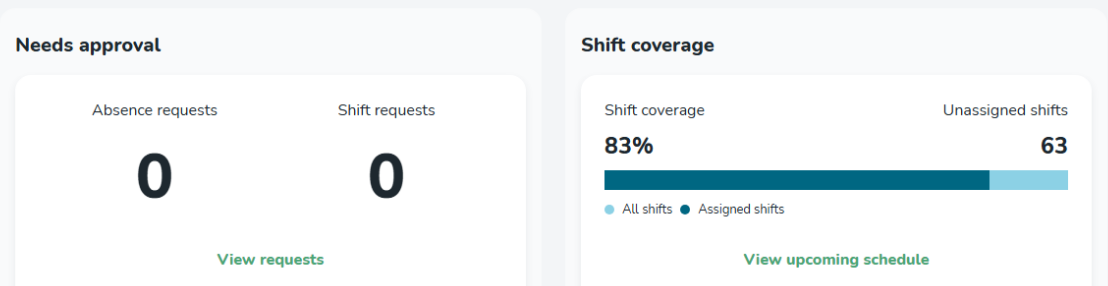
Needs approval
Needs approval will contain information about the number of pending absences and shift requests that need the manager's approval.
- Absence requests: The number of absence requests is counted for the coming 28 days.
- Shift bookings to approve: This is the number of shift bookings not the number of shifts employees have applied for. For instance, if there is one shift for which four employees have applied, this will be displayed as four shift bookings, not as one. Shift unassignment requests are not included in this count.
- View requests: Below the number of pending requests, there is a new link called View requests that will redirect you to the Notifications panel of Schedule view where you can easily resolve pending requests.
Shift coverage
Inside Shift coverage, you can see the number of unassigned shifts and the connected percentage of shift coverage.
- Shift coverage: The shift coverage indicates what proportion of all shifts are currently unassigned. The formula used to calculate this percentage is: (Number of assigned shifts /(Number of assigned and unassigned shifts)) * 100.
- Unassigned shifts: The number of unassigned shifts.
- View upcoming schedule: Below the number of shift coverage and unassigned shifts, there is a new link called View upcoming schedule that will redirect you to the Schedule view of the upcoming 28 days so that you can easily assign those shifts and increase the shift coverage on your unit.
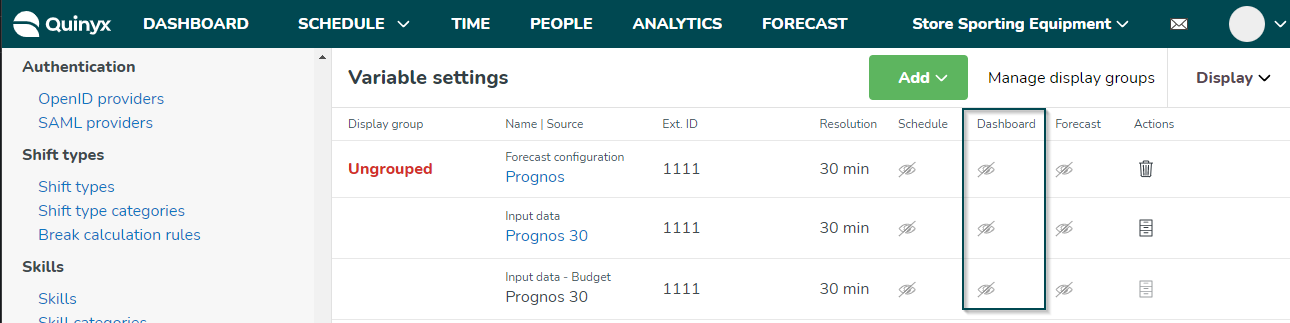
Customizing widgets
In addition to the widgets Quinyx displays by default, you can display forecast-related widgets. To do this, go to Account settings > Optimization settings >Variable settings and allow the various widgets in the Dashboard column.
Access Rights
Please read more about Access rights for more detailed information about what access rights are required to be able to view specific items on the dashboard.