Variable settings, Display groups & Forecast configurations
 Updated
by
Daniel Sjögren
Updated
by
Daniel Sjögren
On the variables settings page, you can create and manage your forecast configurations and variable display options, including adding them to display groups. Display groups affect how variables are visualized in schedule statistics and the Forecast tab.
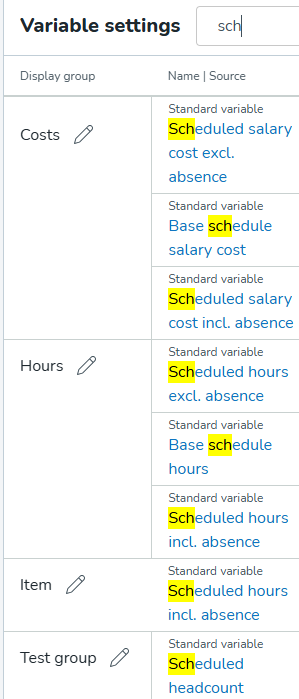
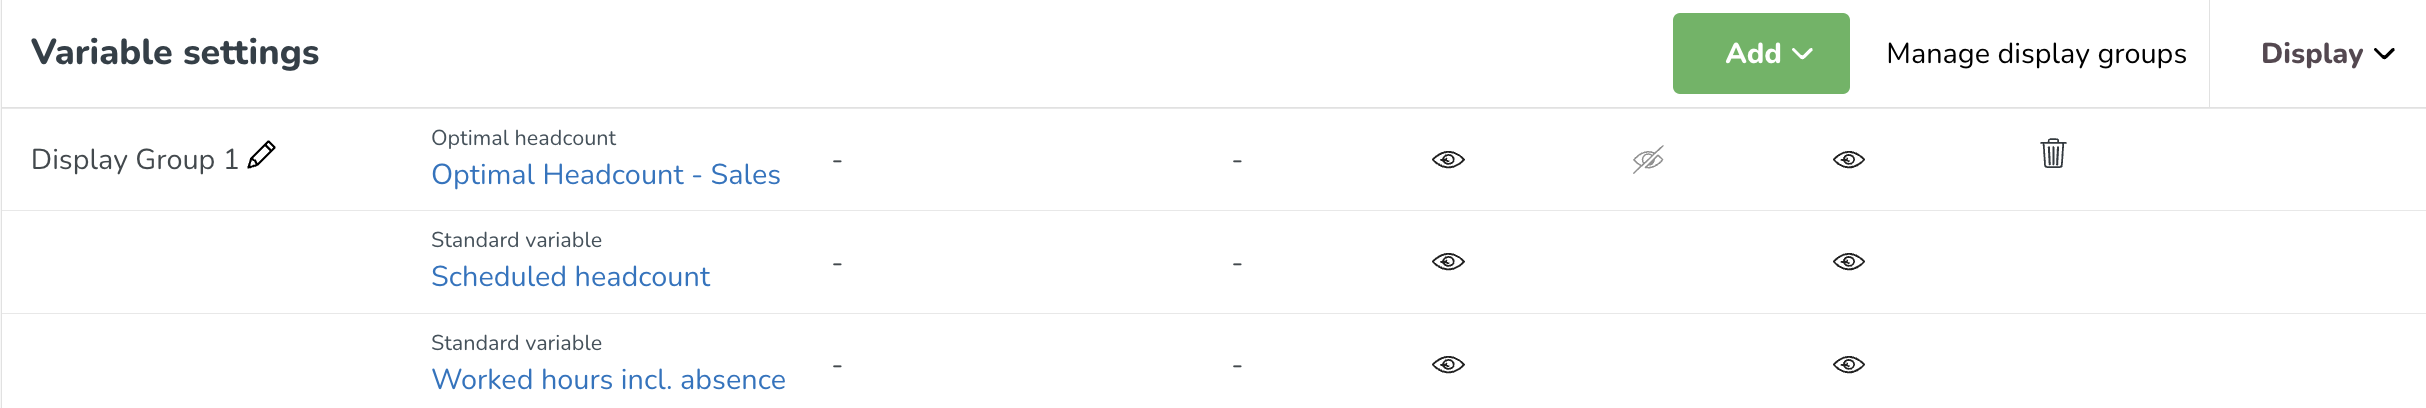
Navigating Optimization settings > Variables > Variable settings will display an overview of all your configurations, calculated and standard variables, and where they are currently displayed.
If you've already created variables and want to edit an existing one, start typing the name in the search box. All variable settings containing those letters will display.
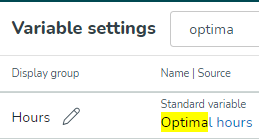
You can filter not only by variable name but also by type of variable (e.g., typing “optima“ will return all optimal headcount variables and variables with names containing “optima“).
Clicking the Add button at the top of the page will give you options to add new Input Data, Forecast Configuration, Calculated Variable, or Optimal Headcount calculation.
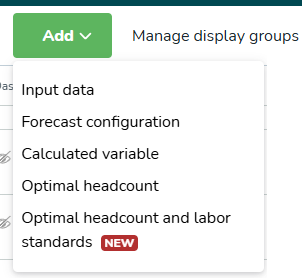
Input data | External data sent to Quinyx via the API. Required to generate a forecast. |
Forecast configuration | A configuration set to determine how a forecast is generated. This must be connected to Input Data. Quinyx uses historical input data to help generate a prediction for the future. |
Calculated variable | A variable that is generated based on calculations performed between 2 or more variables. |
Optimal headcount | Used to generate an optimal headcount calculation based on static and dynamic rules. |
Optimal headcount and labor standards | Used to help you determine the optimal number of staff needed to meet forecasted demand. Read more here. |
Input Data
Forecast input data are what drive staffing needs. This data is pushed to Quinyx from an external system.
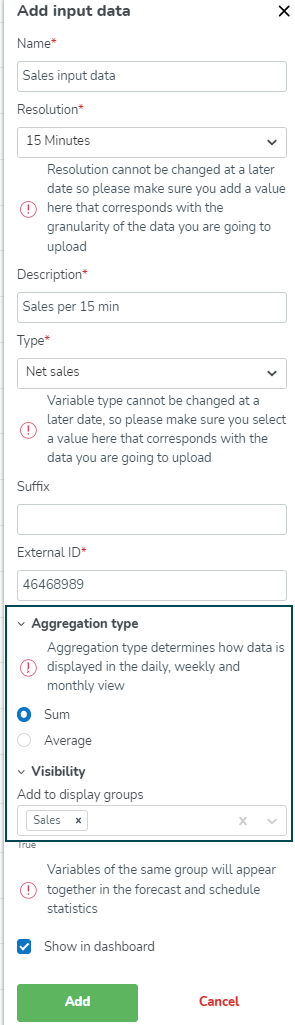
Selecting to add Input data will present the side panel that requires the following information.
Name | This is the name of the input data, e.g., the driver you want to use. For instance. Net sales incl VAT if that will be the data you will use connected to this driver. |
Resolution (minute level) | 5 / 15 / 30 / 60 Minutes: These options let you work with more granular data. For example, choosing 15 Minutes means any time-related data (like staffing demand or shift coverage) will be grouped and shown in 15-minute intervals. Resolution cannot be changed at a later date, so please make sure you add a value here that corresponds with the granularity of the data you are going to upload |
Resolution (daily level) | In addition to existing resolutions (5, 15, 30, and 60 minutes), users can import and work with data at a daily level. Using daily resolution, you can:
You can edit daily data directly within the Forecast tab and the Statistics view. The daily option rolls up all data into one value per day. It’s best used when detailed hour-by-hour insights aren’t needed—useful for high-level planning or reporting. Key differences when editing daily data Compared to editing data with a resolution of 60 minutes or less, editing daily data has the following limitations:
|
Description | This is the description for the input data to be able to identify it easily in the input data list if you have multiple input data. |
Type | This is the type of input variable and for configuration uses and statistical use in analytics the appropriate type should be used that corresponds to your driver. For instance, Net sales incl VAT should be connected to Net sales whereas Gross sales incl TIP should be gross sales. Variable type cannot be changed at a later date, so please make sure you select a value here that corresponds with the data you are going to upload |
Suffix | Not used currently, but will reflect currency or similar in future views. |
External ID | This is the External ID for the input data. This is one of the items an integrator would need in order to upload the correct data towards the correct input data in Quinyx. For instance, in the data warehouse for the POS system (point of sales) the corresponding number for Net sales incl VA. |
Aggregation type | Aggregation type determines how data is displayed in the daily, weekly and monthly view. Choose Sum or Average. |
Visibility | This determines which display group(s) the input data will be displayed in. For the standard variables that are automatically added to default display groups, such as Costs and Hours, as well as the Optimal Headcount variables that are added to the default display group Labor, Quinyx has a small but significant component indicator in the Visibility input that will represent those default display groups. This helps users by providing information about whether a variable is part of any default display group already. 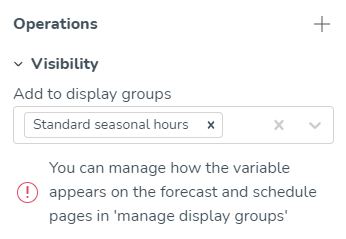 |
Show in dashboard | Define whether this should be visible in the dashboard view. Variables with salary cost calculations will not be shown in the dashboard. |
Forecast Configuration
Once you've created Input Data, you can create a configuration for how future data should be forecasted.
You can do this by selecting Forecast Configuration from the Add button at the top of the page.
Selecting to add Forecast Configuration will present the side panel that requires the following information.
Name | This is the name of the forecast and how it will be named in schedule views and other relevant views. |
Description | A description of this configuration to be able to easily identify it if many configurations are created. |
External ID | An ID for referencing to this specific forecast configuration when using the API. |
Input data | Here you choose what input data should be used. You may have multiple configurations for the same input data. |
Forecast formula/Data algorithms | This is where you define what algorithms to use. Currently, the following exists:
Quinyx will automatically generate a forecast for 90 days ahead as long as at least 60 days worth of historical data is available. Read more here. |
Aggregation type | Aggregation type determines how data is displayed in the daily, weekly and monthly view. Choose Sum or Average. |
Visibility | Determines which display groups the input data will display in. You can manage how the variable appears on the forecast and schedule pages in Manage display groups. |
Dashboard | Select whether this should be visible in the dashboard view. |
Calculated variables
A calculated variable is derived by performing a calculation using two other variables—these can be standard variables, input data, or a mix of both.
When you choose to add a calculated variable, a side panel will open where you’ll need to provide the following details.
Name | The name of your calculated variable and how it will be presented in different views. |
Description | The description of your calculated variable that will be visible in the system as a reference to the calculated variable. |
External ID | An ID for referencing this specific variable when using the API. |
Formula | This is where you define the calculation of your variable. |
Primary input | The Primary input is the first variable you want to use for your calculation. You can choose from the standard variables and also from Forecast variables and configurations if you have Neo Forecast activated for your organization. This will be the input data before the operator. |
Custom Input | Allows you to add a specific figure to the custom variable equation instead of a second variable. Note that no calculation will be performed if the data on the primary input is 0. These calculations will be performed at the resolution that your input data is set to; 5min, 15min, 30min, 60min, Daily. |
Operator | The operator decides what should happen with the data you choose to create a calculated variable with. The available operators are:
|
Secondary input | The Secondary input is the second variable you want to use for your calculation. You can choose from the standard variables and also from Forecast variables and configurations if you have Neo Forecast activated for your organization. This will be the input data after the operator. |
Visibility | Determines which display groups the input data will display in. |
Show in dashboard | Define whether this should be visible in the dashboard view. Currently variables with salary cost calculations will not be shown in the dashboard. |
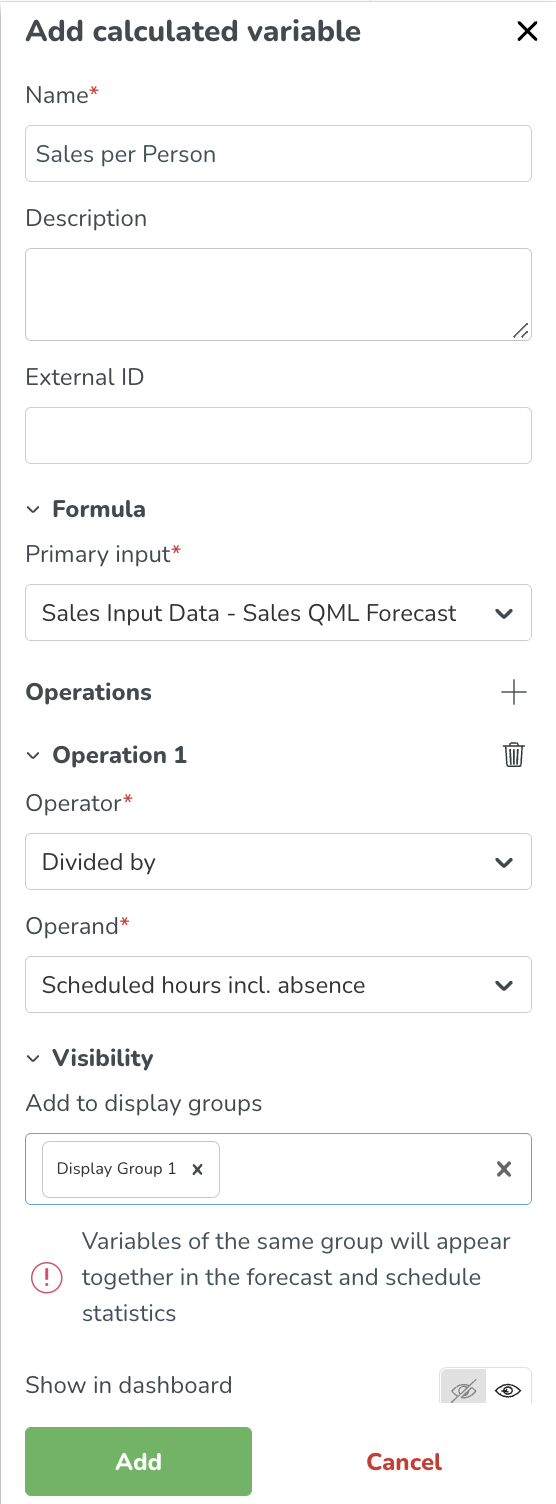
Example of a calculated variable
Predicted sales per scheduled person hour is a commonly used KPI within many verticals.
To create such a variable, you must have a forecast configured in order to have a predicted sales value. Quinyx can auto-generate this prediction using AI - with your organization providing the actual sales.
Read more about Algorithms and predictions here.
- Primary Input: Predicted sales
- Operator: Divided by
- Secondary input: Scheduled hours
Example of a multiple operator calculated variable
We will use this wild example to show how multiple operations are calculated.
The calculation will be performed where the totals of each operation will be used in the following operation, using the screenshot example below, the calculation will be performed like this:
- Optimal Hours + Scheduled Hours = x
- x + Worked Hours = y
- y + Custom input = z
- z / custom input = output displayed in the GUI
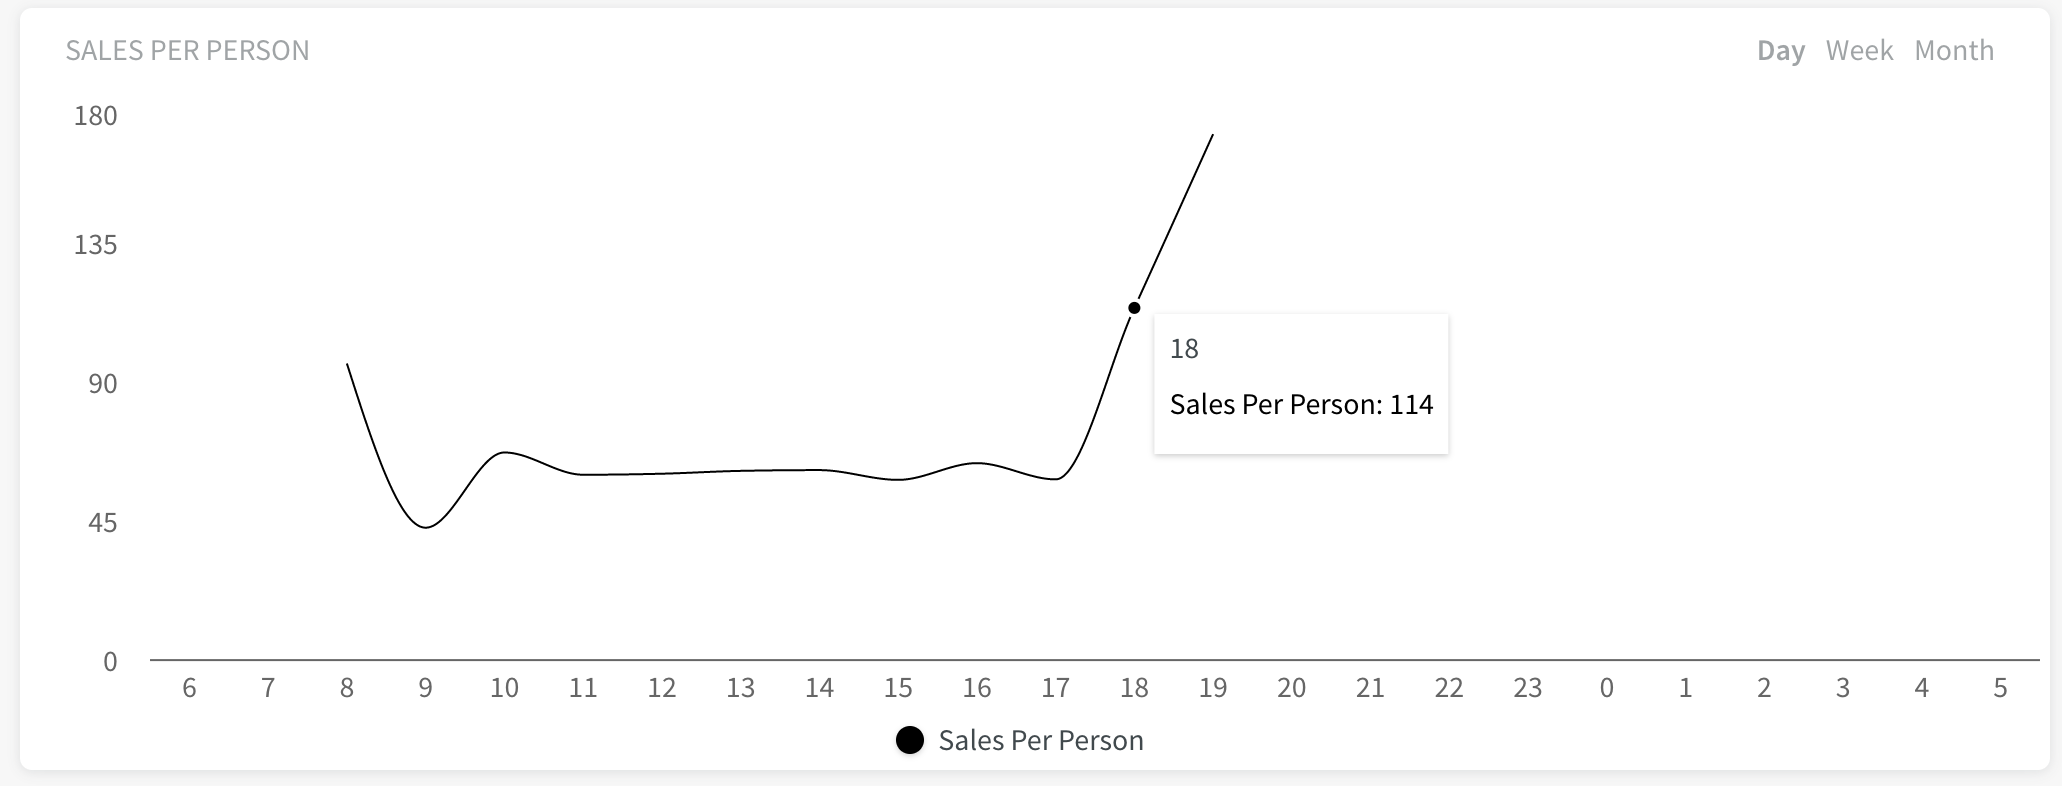
View calculated variables in the Dashboard
A calculated variable will have a separate graph in the Quinyx dashboard. It will still have the options for selecting the current day, current week, and current month - the same way the existing widgets are in the dashboard today.
View calculated variables in the Forecast Overview
The calculated variable must be added to a display group in order to show on the Forecast overview page.
Selecting Aggregation Type on variables
Aggregation type determines how data is displayed in the daily, weekly, and monthly views.
You have the option to select aggregation type on Input Data, Forecast Configuration, Calculated variable, or Optimal Headcount variables on the Variable settings page. When selecting aggregation type, choose between Average and Sum on each variable.
- Sum: When Sum is selected, no changes are made to the current aggregated data calculations.
- Average: When Average is selected, instead of summing up the values to show the daily total, Quinyx instead shows the daily average. The same holds when viewing data in the daily, weekly, or monthly view. The average is calculated by accounting for the values of each bucket with existing data and then calculating the average value based on those number of buckets.
For Forecast Configuration variables, the aggregation type, by default, is the same aggregation type as the one selected for the underlying Input Data.
By default, all existing Input Data, Forecast Configuration, or Optimal Headcount variables will have Sum as their aggregation type, and as such, no adjustments are made to the current aggregation calculations. When you add a new variable, Input Data variables will by default have Sum, while Optimal Headcount variables will by default have Average as the selected aggregation type.
How does it work?
Quinyx ensures that the calculation in all cases is performed at every granularity level. The examples below are specifically for calculated variables, including multiple variables of the same or of different aggregation types. For normal input data, forecast configuration, or optimal headcount, Quinyx does the general average or sum. It's different for calculated variables because with calculated variables, you actually don’t have the option to choose an aggregation type, but the aggregations are calculated based on the examples below.
Example 1
- Variable A (aggregation type sum)
- Variable B (aggregation type average)
- Calculated variable C: A/B
- Daily C = daily (sum) A / daily (average) B
The Daily C calculation is performed based on the daily values of the underlying variables.
Example 2
- Variable A (aggregation type sum)Variable B (aggregation type sum)
- Variable C (aggregation type sum)Calculated variable D: A+B-C
- Daily D = daily (sum) A + daily (sum) B - daily (sum) C
The Daily D calculation is performed based on the daily values of the underlying variables.
Example 3
- Variable A (aggregation type sum)Calculated variable B: A+100 (custom input)
- Daily B = daily (sum) A + 100
The Daily B calculation adds the custom input as defined in the calculated variables, not as a sum of the addition of the custom input at the lowest granularity.
Optimal Headcount Variables
Customers who are using static and dynamic rules in conjunction with their forecasted input data to generate an optimal headcount read-out will need to create an Optimal Headcount Variable that is linked with those rules.
Navigate to Add > Optimal Headcount.
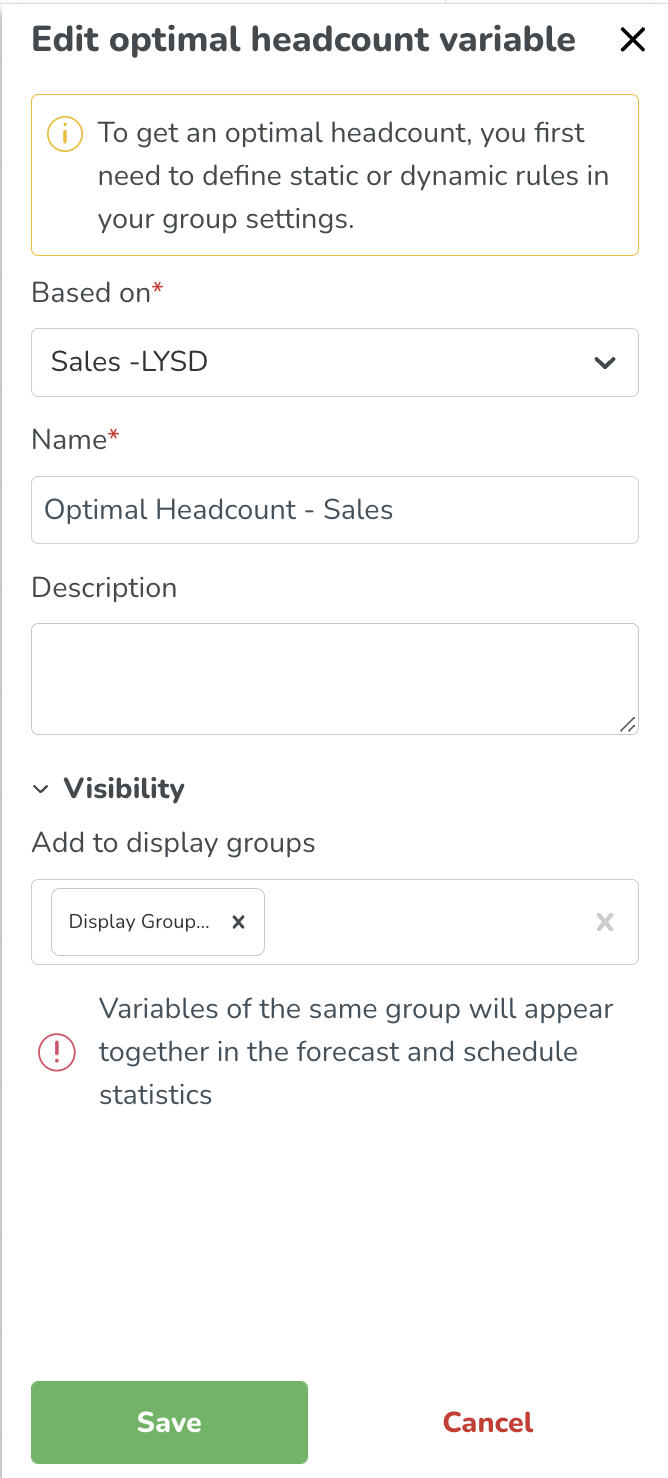
Based On | Which set of rules should the optimal headcount calculation be based on - here you will automatically see any forecast configurations that have been created and have static or dynamic rules associated with them. In the future, we will add support for static rules only. Once the variable has been created, the calculation will automatically be done. |
Name | What you want your Optimal Headcount Variable to be called. |
Description | A description of this variable to be able to easily identify it. |
Aggregation type | Aggregation type determines how data is displayed in the daily, weekly, and monthly view. Choose Sum or Average. |
Visibility | Determines which display groups the input data will display in. You can manage how the variable appears on the forecast and schedule pages in Manage display groups. |
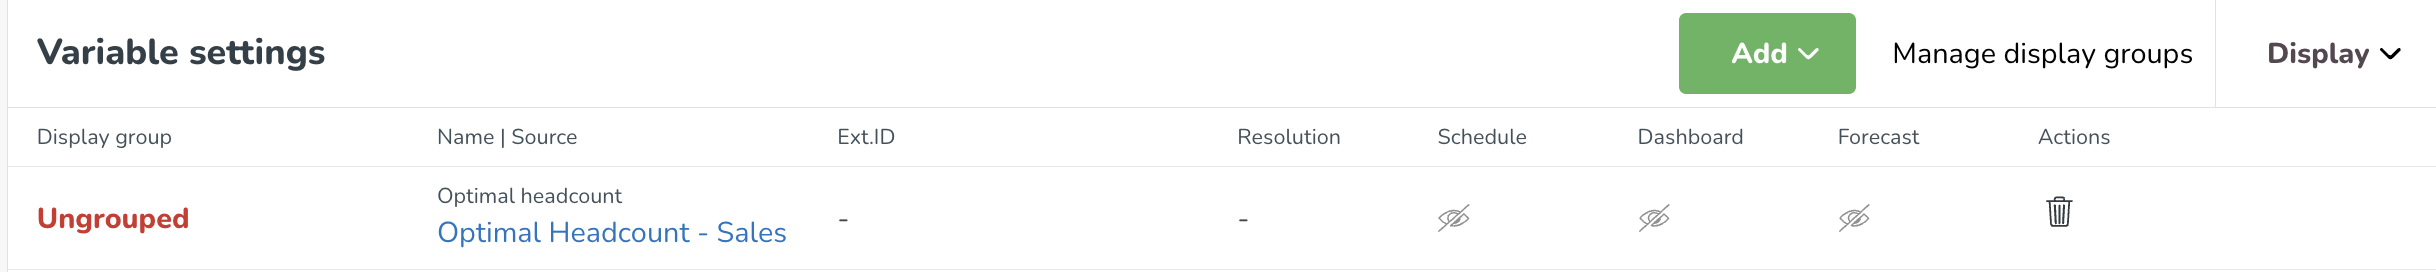
The Optimal headcount variable will now display in your variables list inside the display group you have assigned it to, or as ungrouped if you have not yet assigned it one.
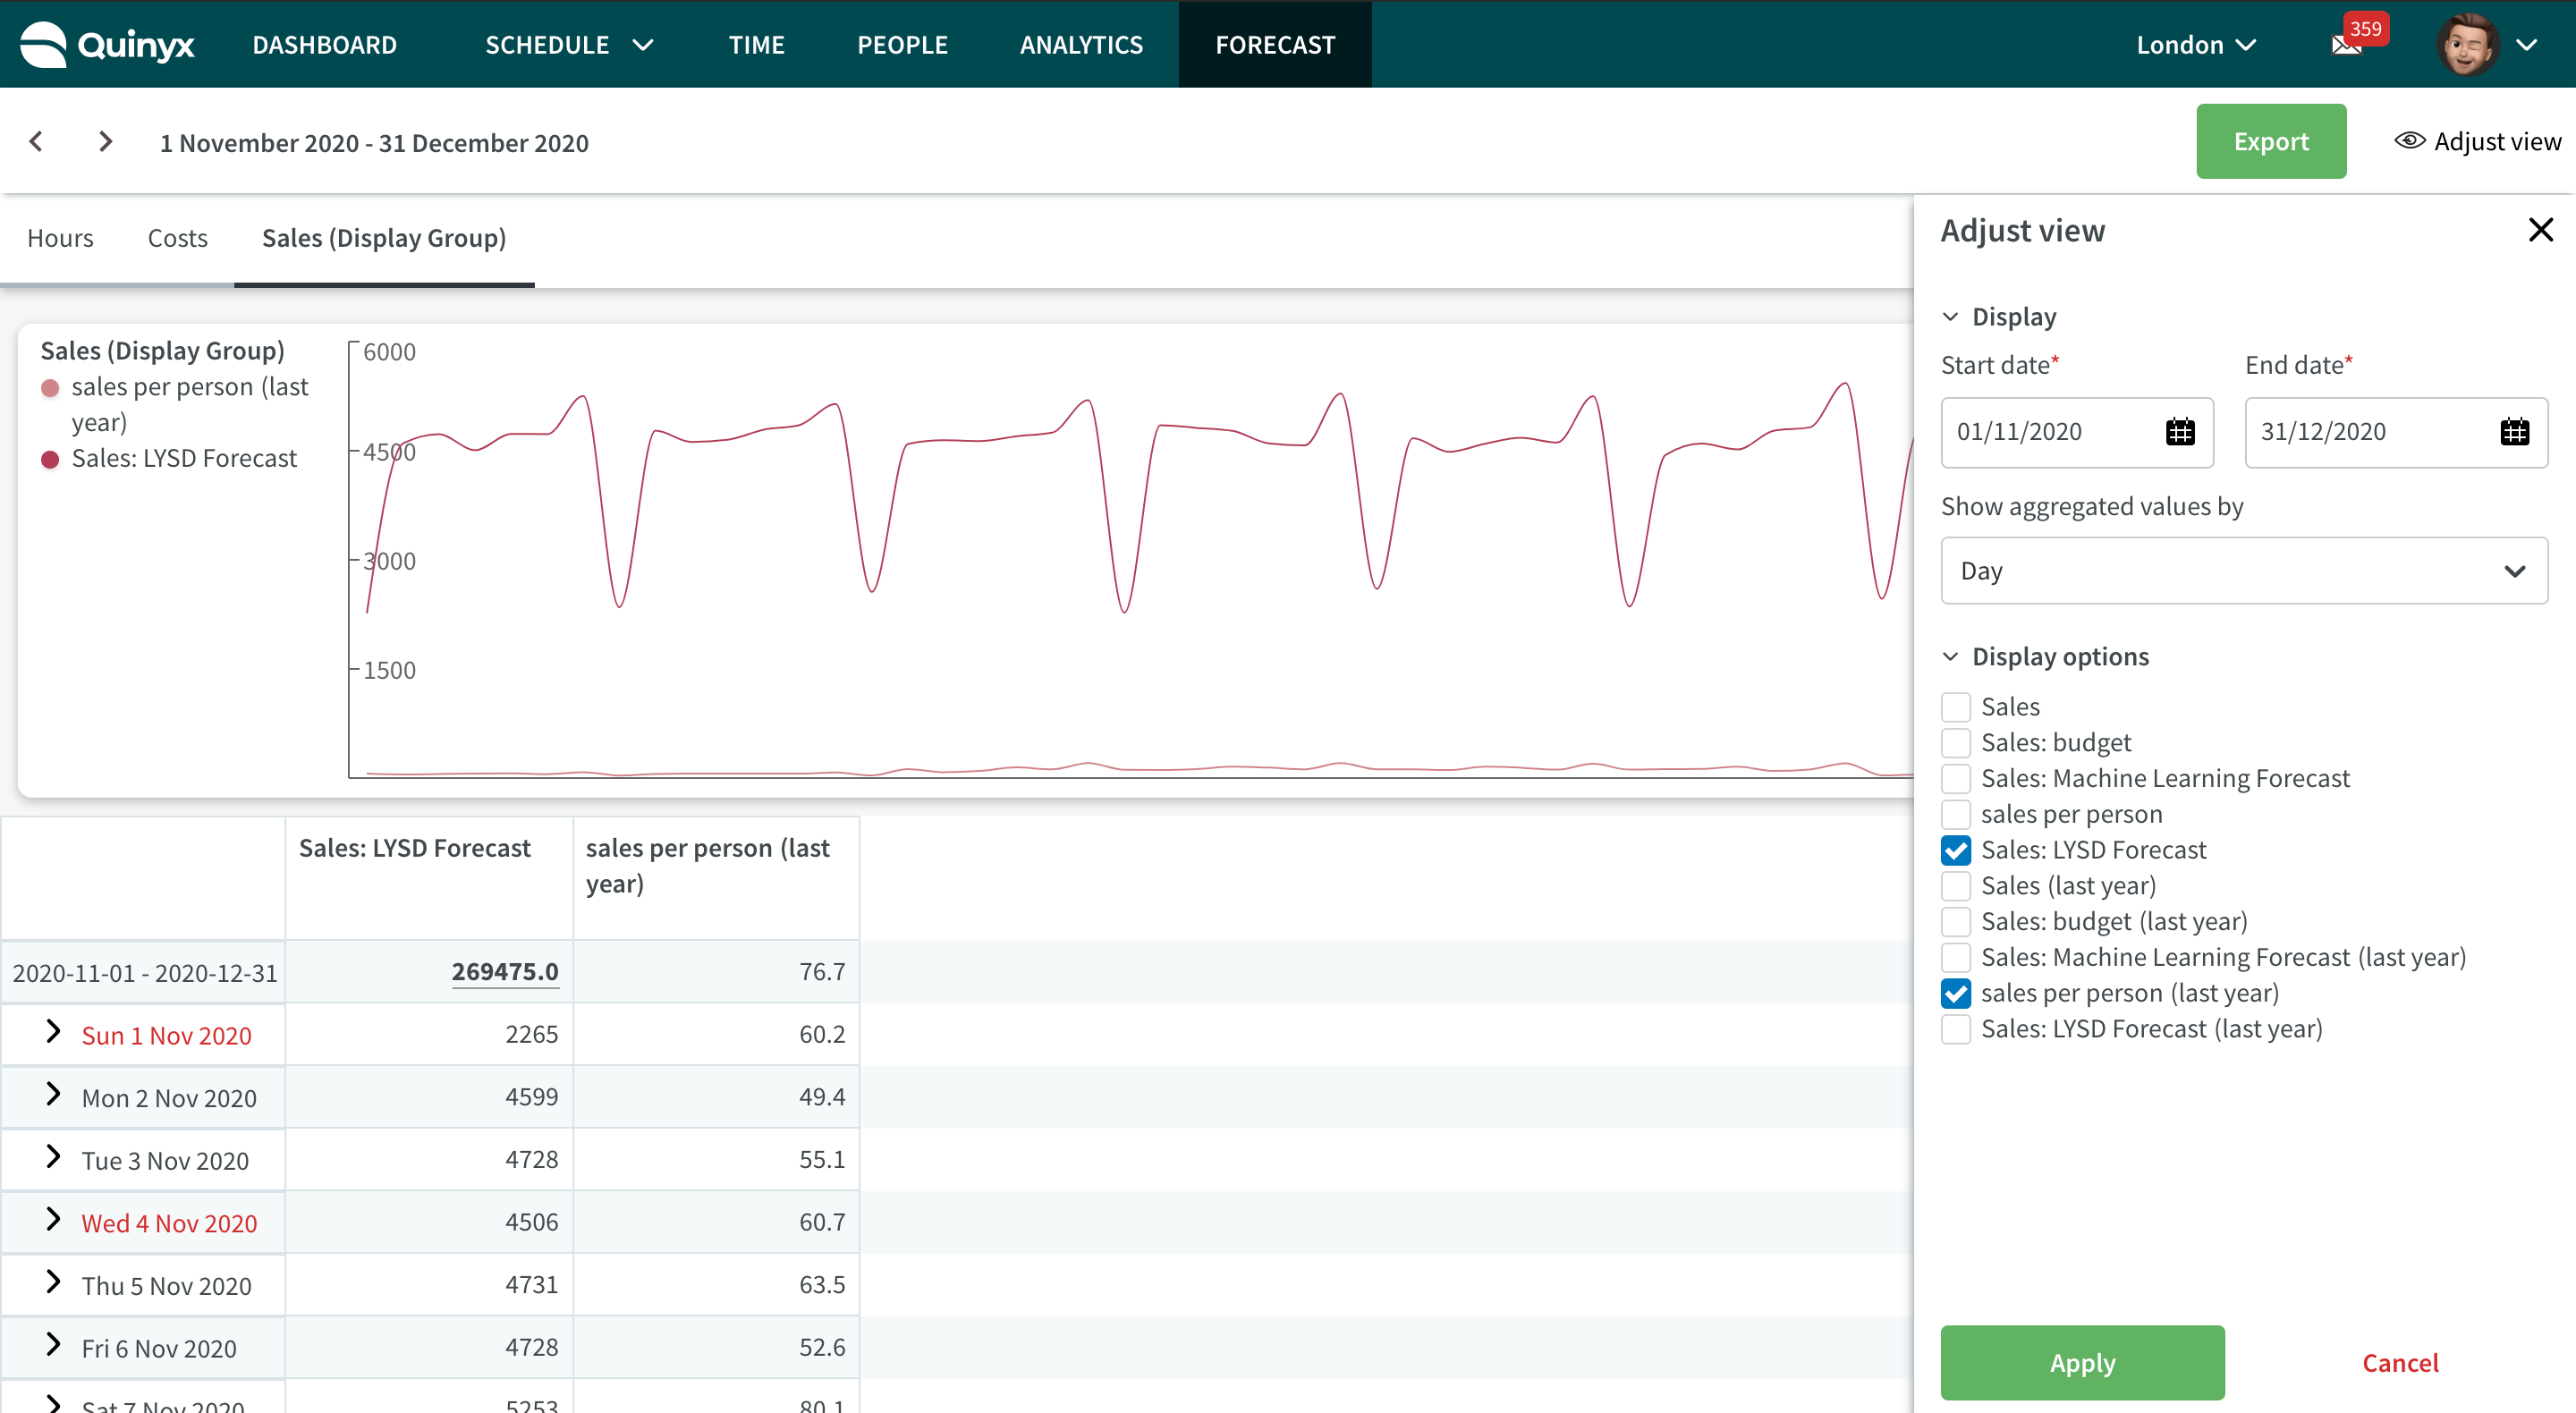
Display groups
Display Groups are a way of grouping input data, standard variables, optimal headcount variables, and calculated variables into a single group so that they display together on graphs and tables inside the Forecast Overview and within Schedule Statistics.
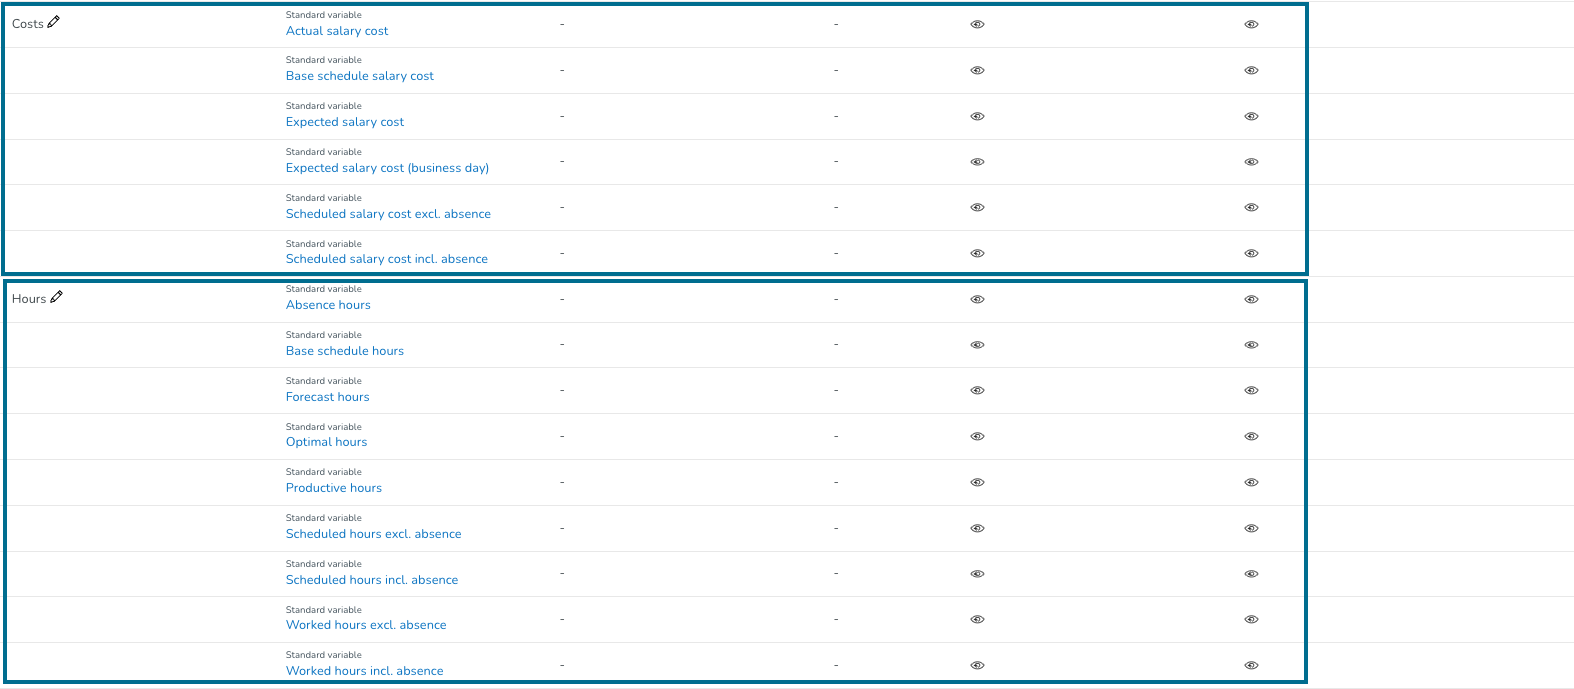
By default, Quinyx will have two display groups: Costs and Hours. We also have a third standard display group called Labor, which automatically will be added if you create an optimal headcount using the Optimal Headcount & Labor Standards - NEW functionality. You can still manage the variables inside these groups. Read further on to learn how this is done.
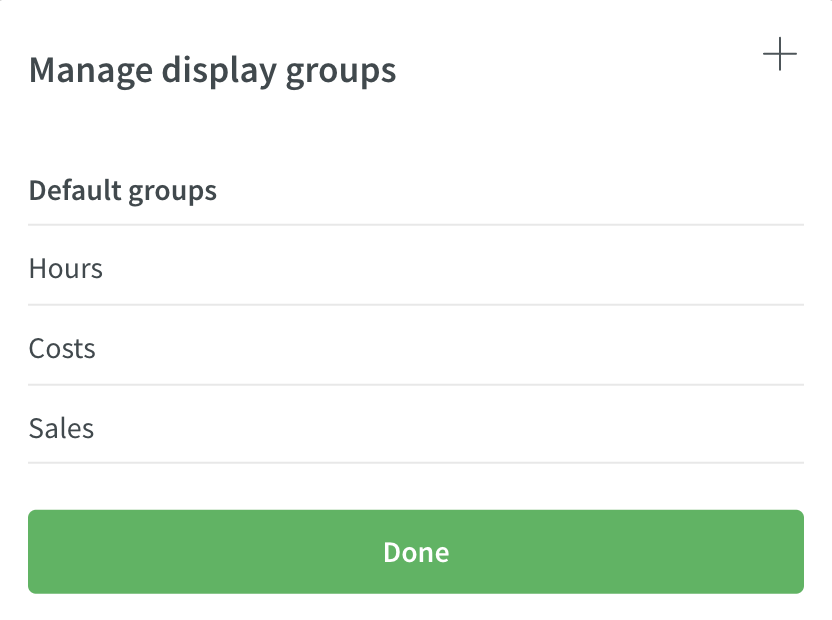
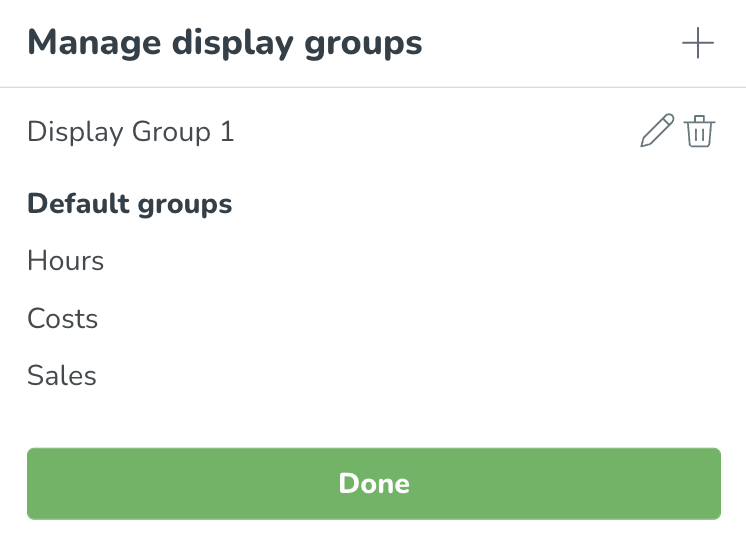
To create a new display group, click on Manage Display Groups at the top of the page.
This will bring up a window showing all current display groups. Click on the + to create a new group.
Enter your new display group name, and select which variables you want to display together in this group and click Next.
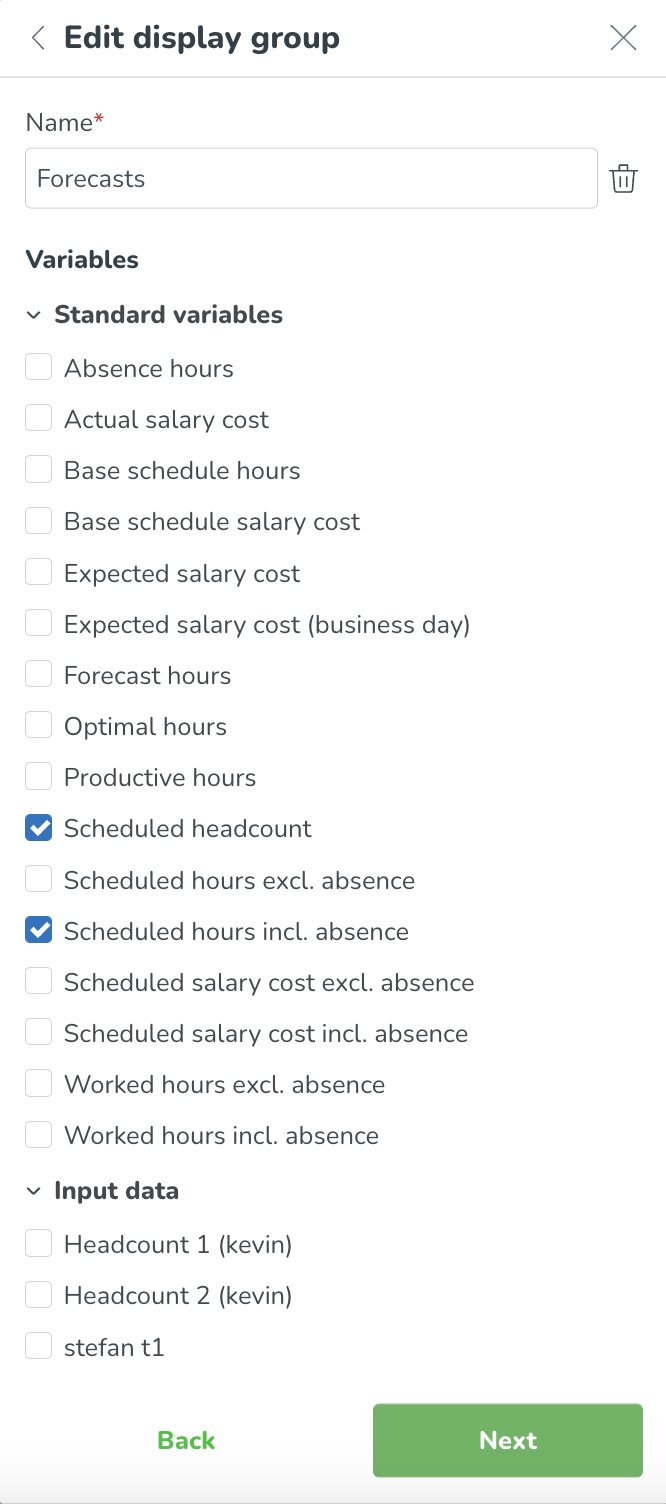
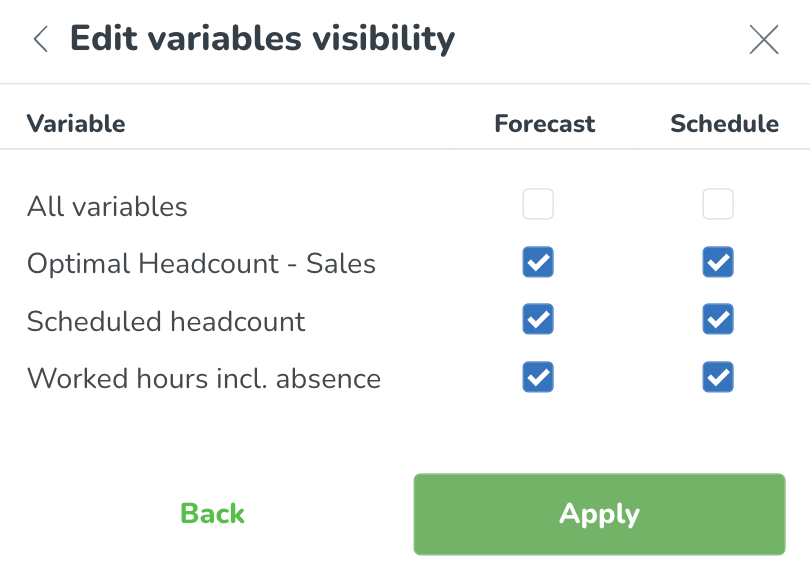
On the following page, you can choose which variables you want to be visible in schedule statistics and the forecast tab. Click Apply to save your changes.
Your new group has been created and will now be displayed in the list of manageable display groups.
You can edit the name by clicking Manage display groups > then the pencil, or you can delete the display group by clicking the trash can.
Clicking on the pen icon will allow you to edit the variables you want to show inside the display group. Remember that the variables you select here will show together on graphs and tables.
You can now navigate to the Schedule or Forecast tabs to see and manage the variables inside the display groups.
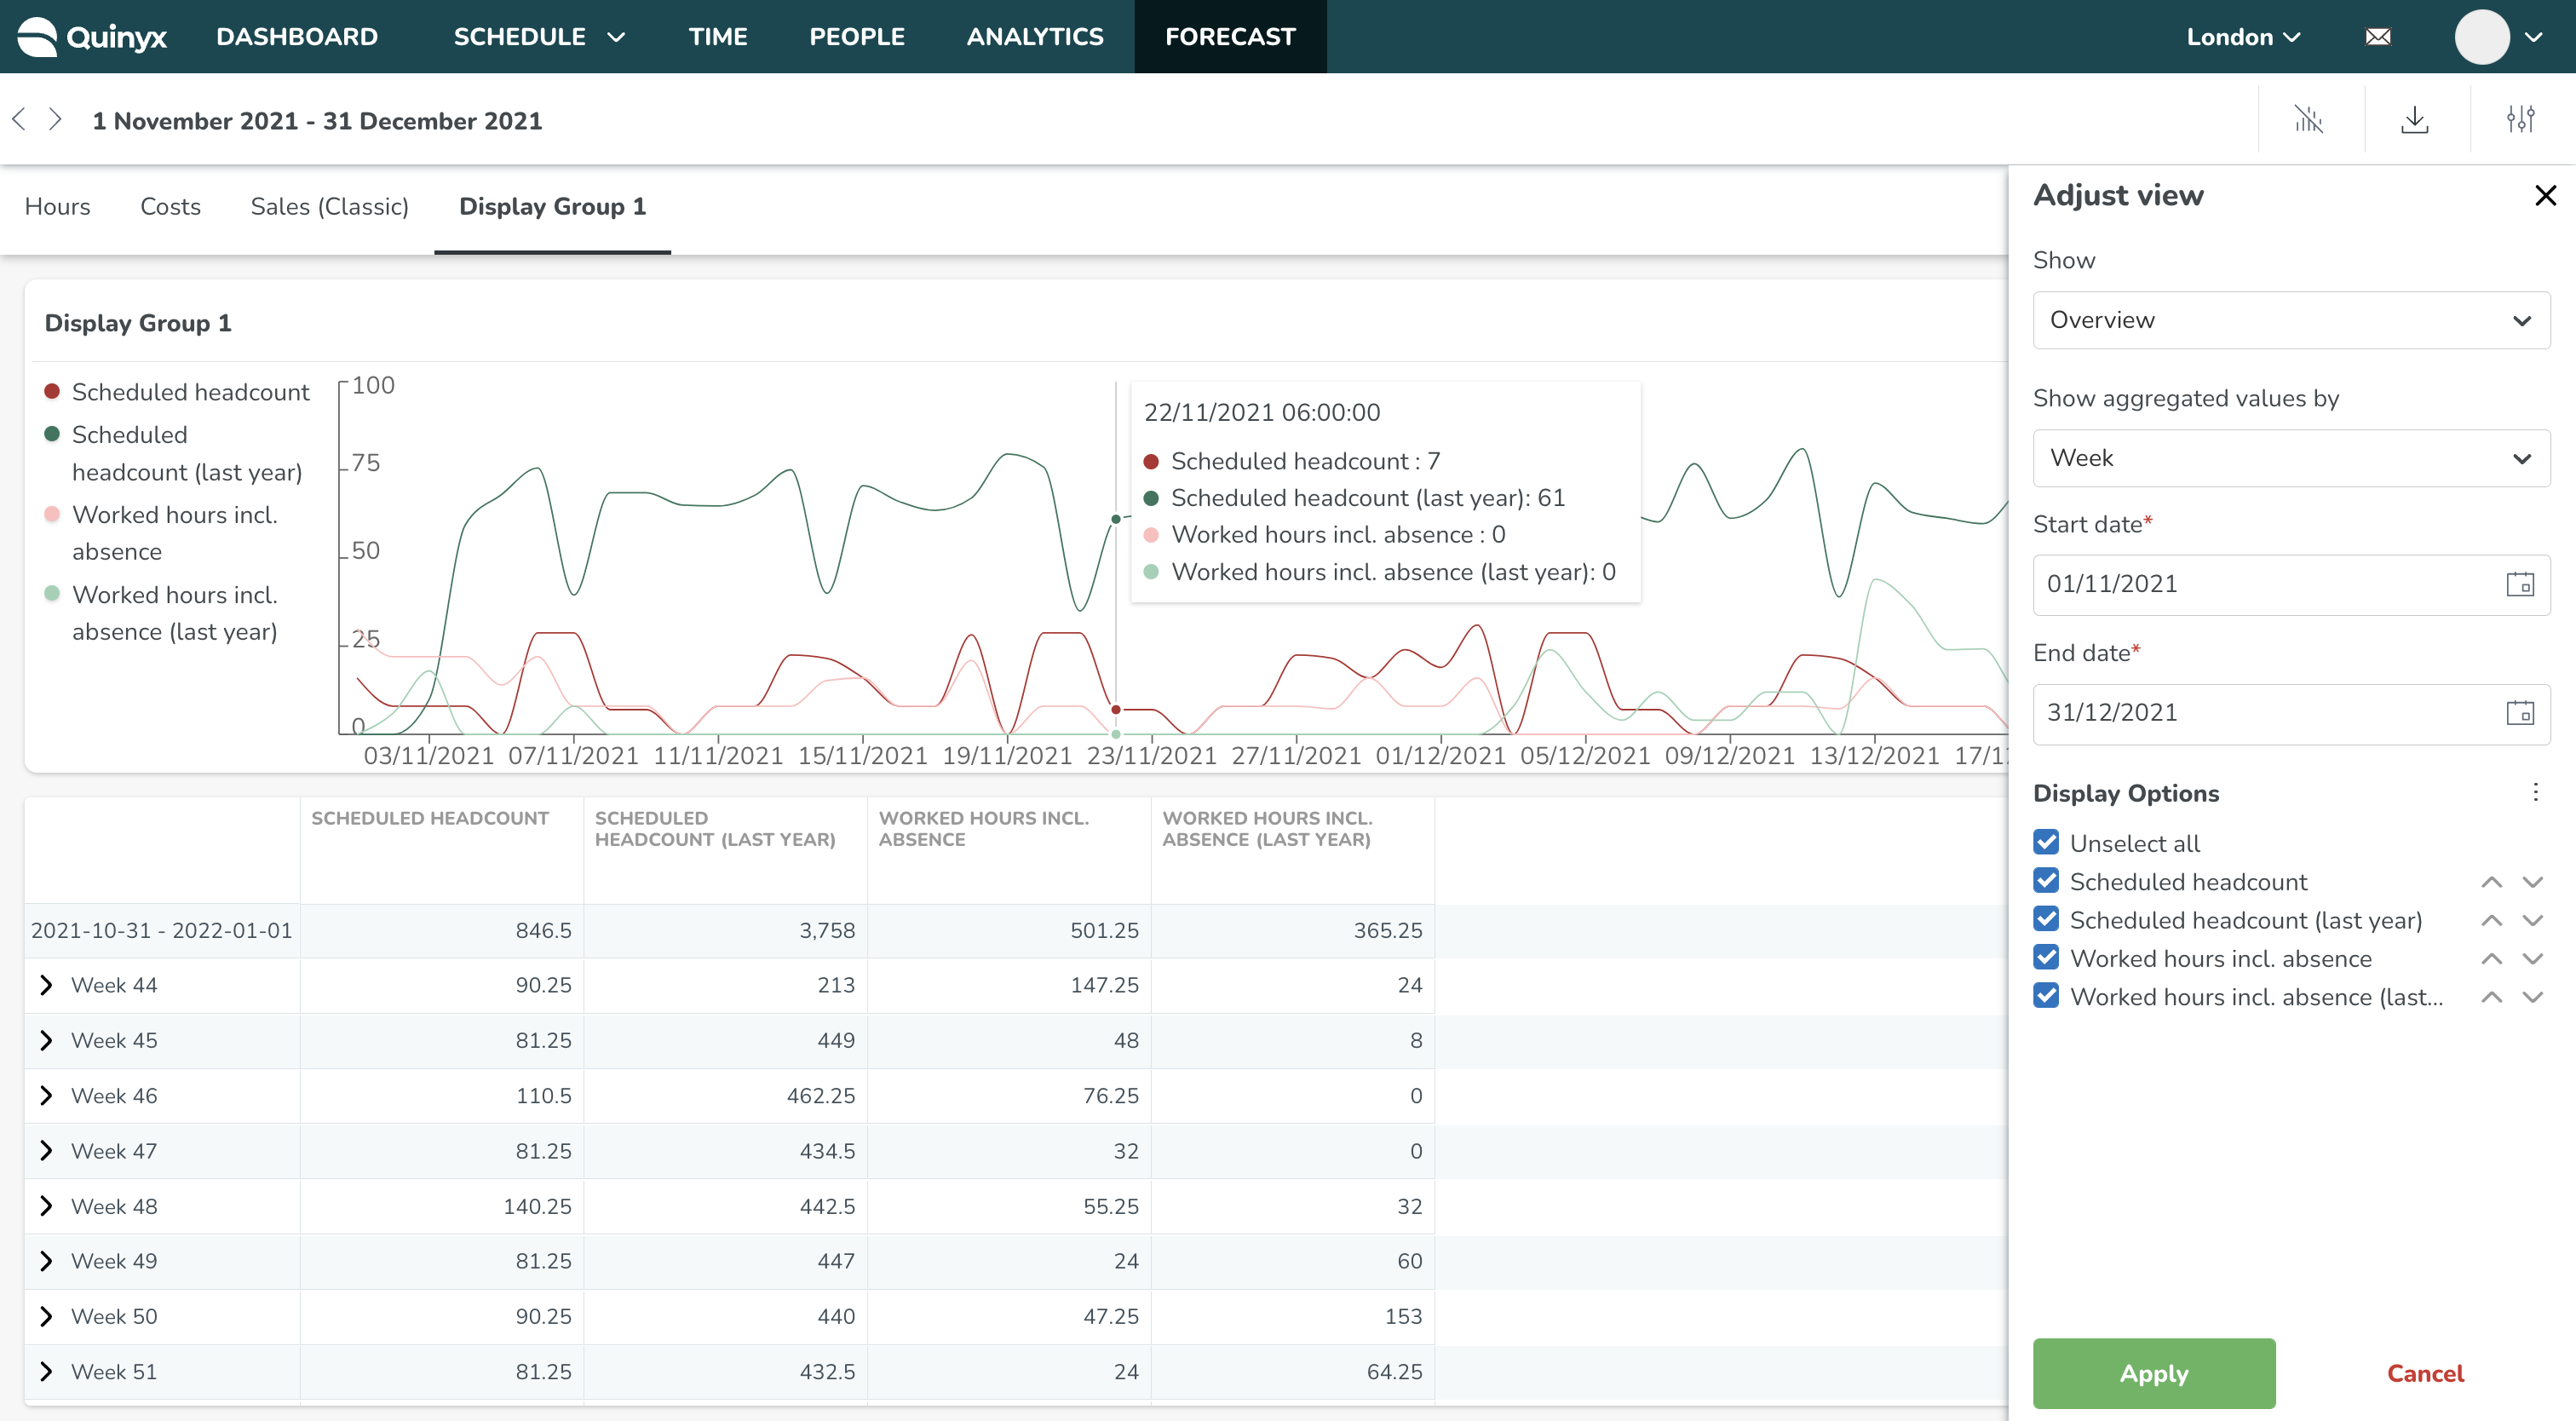
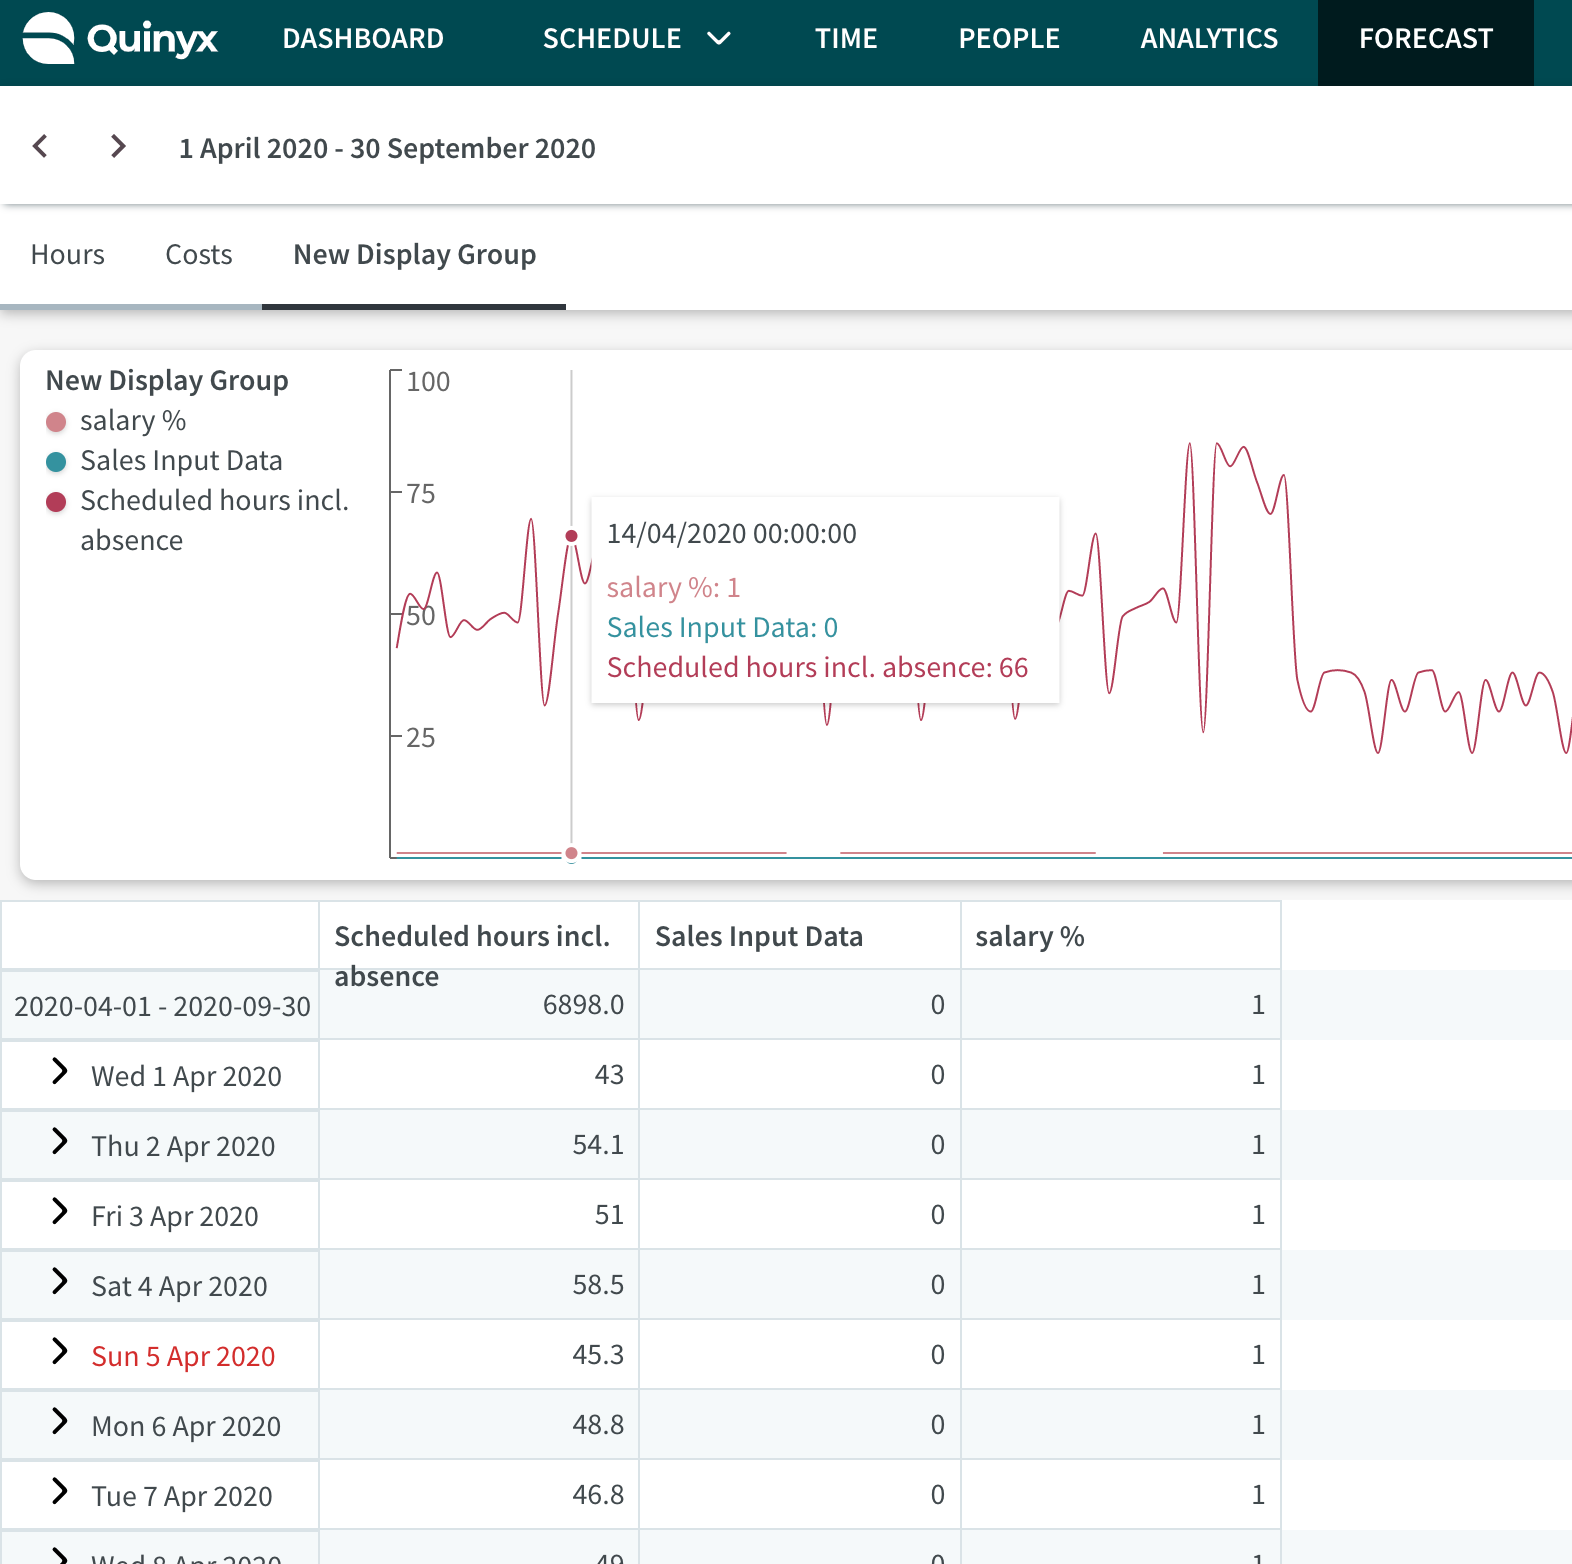
Display Groups in Schedule Statistics
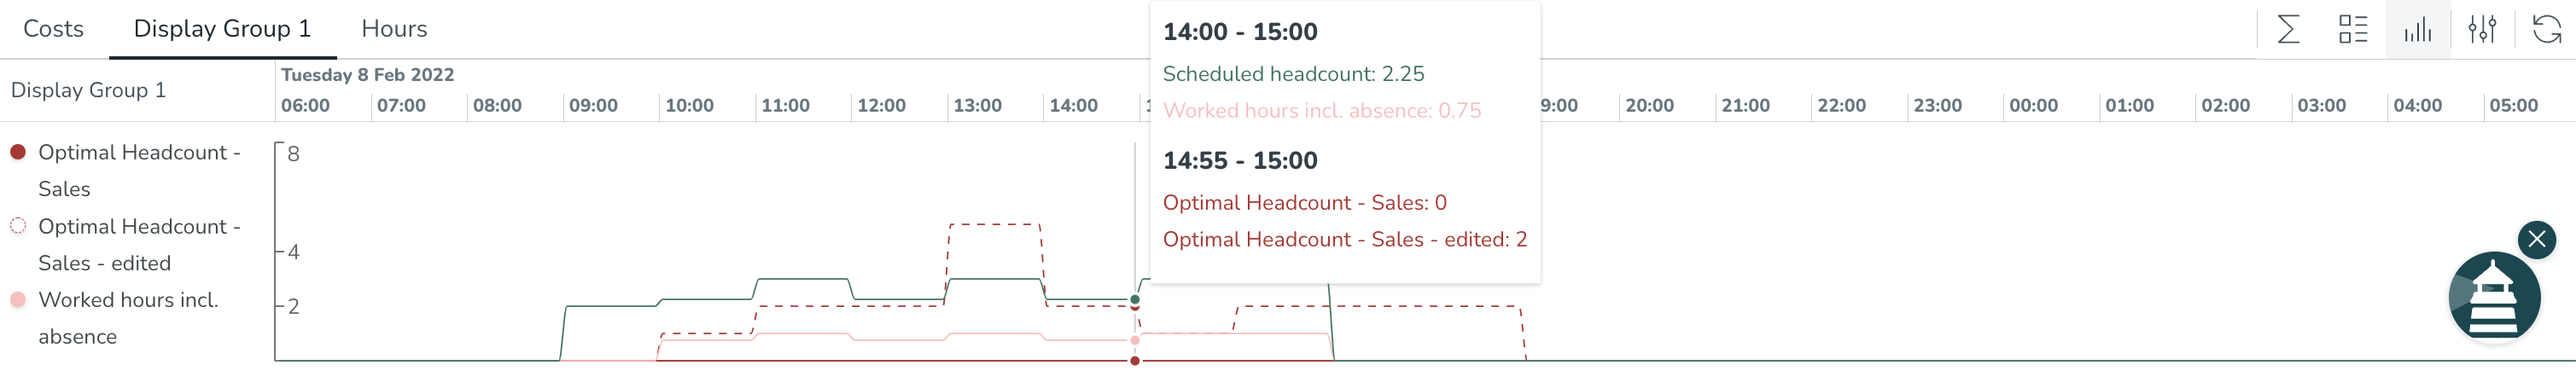
Display Groups in Forecast