Introduction to Forecast & Optimization
 Updated
by
Daniel Sjögren
Updated
by
Daniel Sjögren
Getting Started
Using forecasting and optimization tools in Quinyx can help ensure your business is optimized for the goals it has set out to achieve. Forecast and optimization tools can also help automate tasks for you.
In this article we will cover:
- Setting up your Input Data
- Generating a Forecast
- Variable Display Groups & Calculated Variables
- Optimal Headcount Indicator
- Forecast Analysis & Editing
Some of the key functionality in this area of the product includes generating a forecast for your business drivers, automatically generating schedules and assigning shift, allowing schedule managers to see where they are over and under staffed, and presenting tools you can use to analyze forecasted, actual, and budged data within the business.
To begin setting up forecast and optimization tools, you will need:
- Admin / Superuser access to Quinyx
- An understanding of what data is used to drive your labor requirements (sales, tickets, footfall, etc.)
- An understanding of where this data is kept
- A technical resource to integrate the source of this data to Quinyx using our REST APIs
Continue reading below to follow a step-by-step guide about how to set up these tools within Quinyx
1. Setting up your Input Data
Input data refers to any data that is given to Quinyx from other systems. Data such as Sales comes from a Point of Sale system or a BI tool - this would be an example of Input data. If you want Quinyx to display your input data for schedule guidance, or create a forecast for your input data, you will need to push the data into Quinyx using our REST APIs.
2. Generating a Forecast
Now that Quinyx has access to your input data, Quinyx can use this data to generate a forecast for you using one of our algorithms. Alternatively, you can generate a forecast outside of Quinyx and then send this to Quinyx using our REST APIs.
3. Variable Display Groups & Calculated Variables
Variables such as hours, costs, and any input data you have decided to create are able to be arranged into groups for analysis and shown/hidden in dashboards and scheduling views based on what you would like your schedulers to work with.
Read more about configuring your Variable Settings here but note that some of this information will relate to the Forecast Overview, which we will address in Step 5.
You may also want to create a variable that's calculated from two separate variables, such as Salary Percentage. This would be generated by setting up a calculated variable that used Forecasted Cost divided by Forecasted Sales. This is referred to as a calculated variable.
4. Optimal Headcount Indicator
One of the biggest benefits of using forecast and optimization features from a schedule perspective is being able to see how optimal your schedule is based on your business rules. For example (below), we can visually see how well we are staffed to meet the labor demand relating to the sales forecast. Turns out we are rather understaffed!
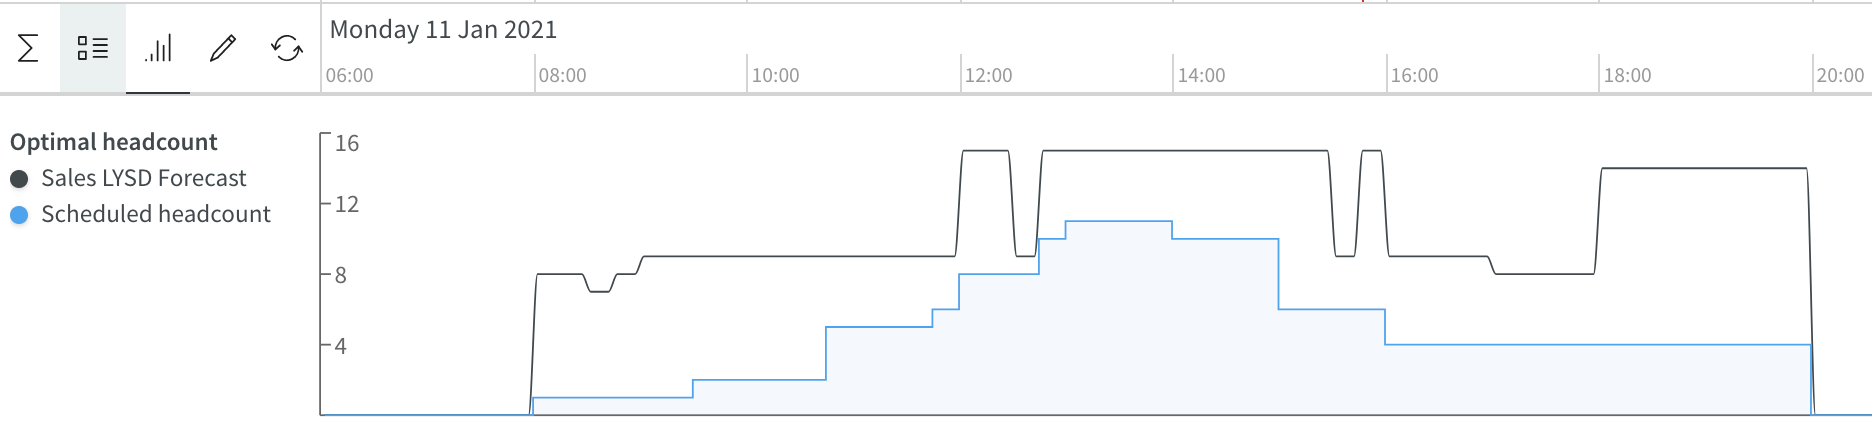
To configure the optimal headcount indicator, you need to define your static and/or dynamic labor rules.
Once you have set up these rules, you will be able to view your optimal headcount indicator in the Schedule and Forecast tabs.
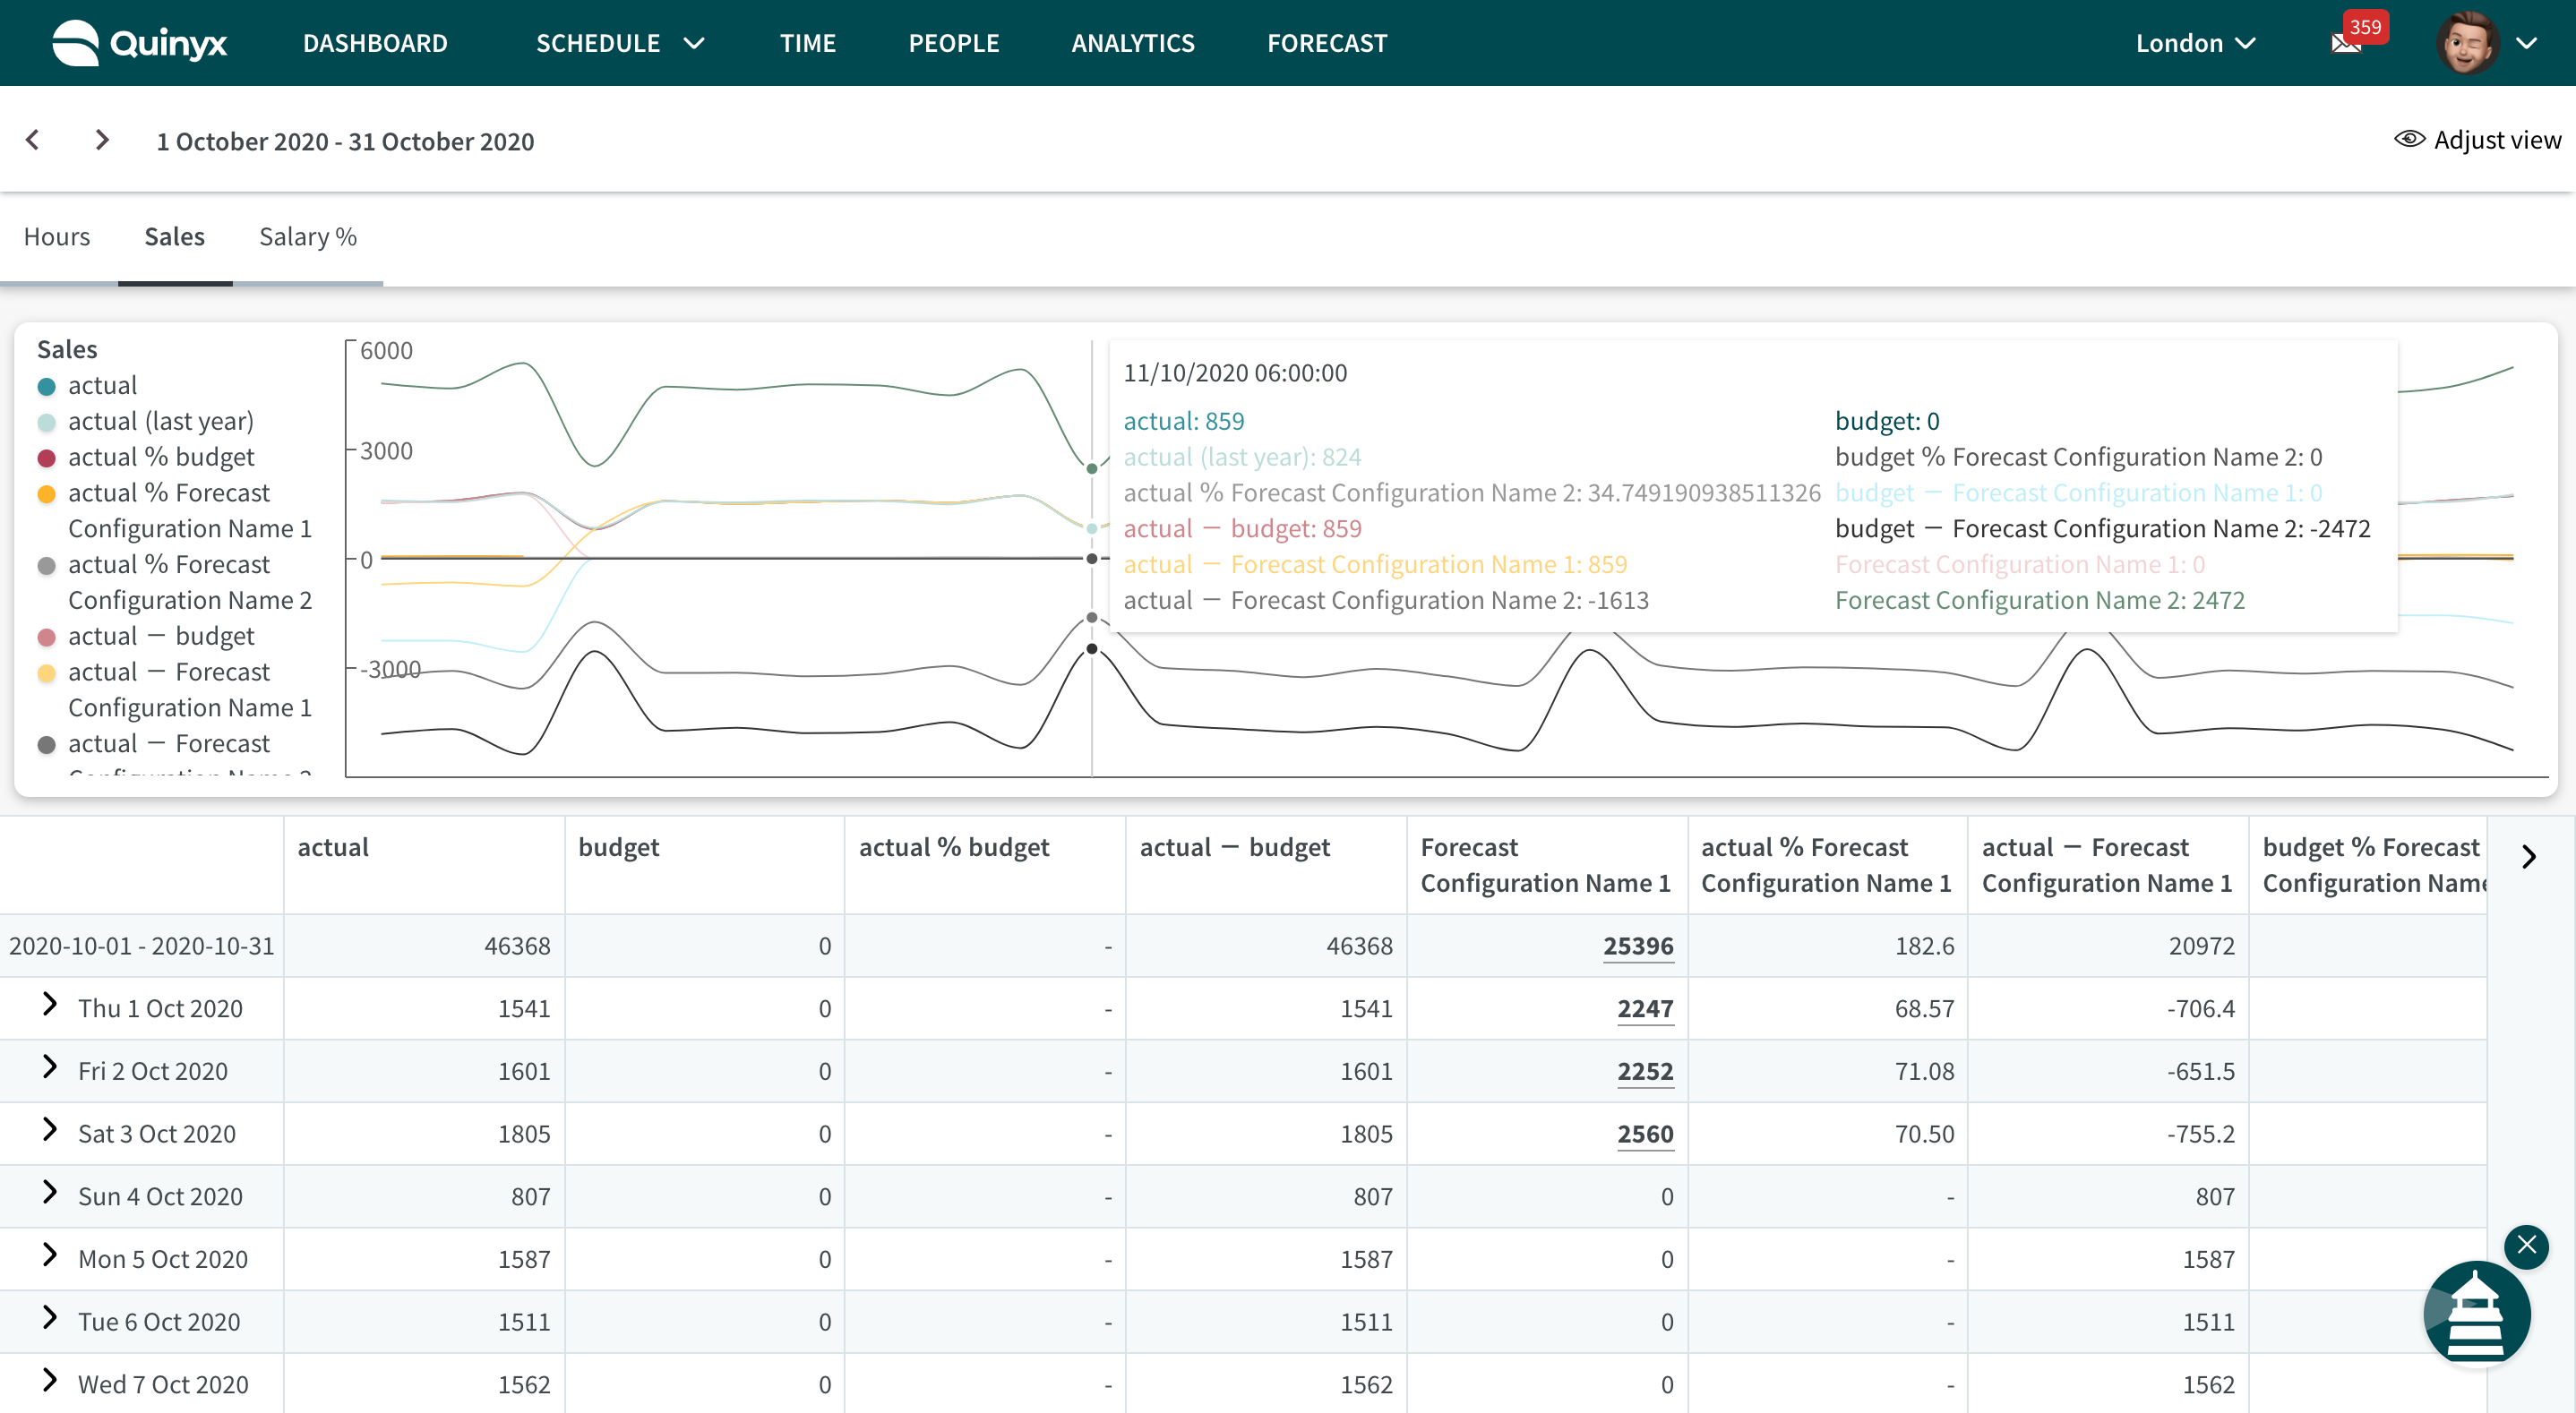
5. Forecast Analysis and Editing
The Forecast tab in Quinyx allows you to edit your forecast data and analyze and compare data between units. This tab can be turned off/on per user role and should typically be accessible to those roles to have permission to make edits to the forecasted input data and/or want to dig into trends of data in one or more units.
Forecast configurations and forecast-related data is not copied to the Quinyx RC environment. Should you wish to use RC for testing, we recommend setting up your test configurations manually inside Quinyx RC and pointing any API-related tests to Quinyx RC where required.