Configuring Optimal Headcount
 Updated
by
Daniel Sjögren
Updated
by
Daniel Sjögren
In order to see optimal headcount in Quinyx, you first need to have the following items configured:
- Input data: Data that comes into Quinyx from an external source to help drive
- Forecast configuration: A prediction for the future that will help drive your optimal headcount calculations
- Dynamic rules and/or Static rules: Rules for how many headcounts should be applicable
Viewing Optimal Headcount
Schedule statistics
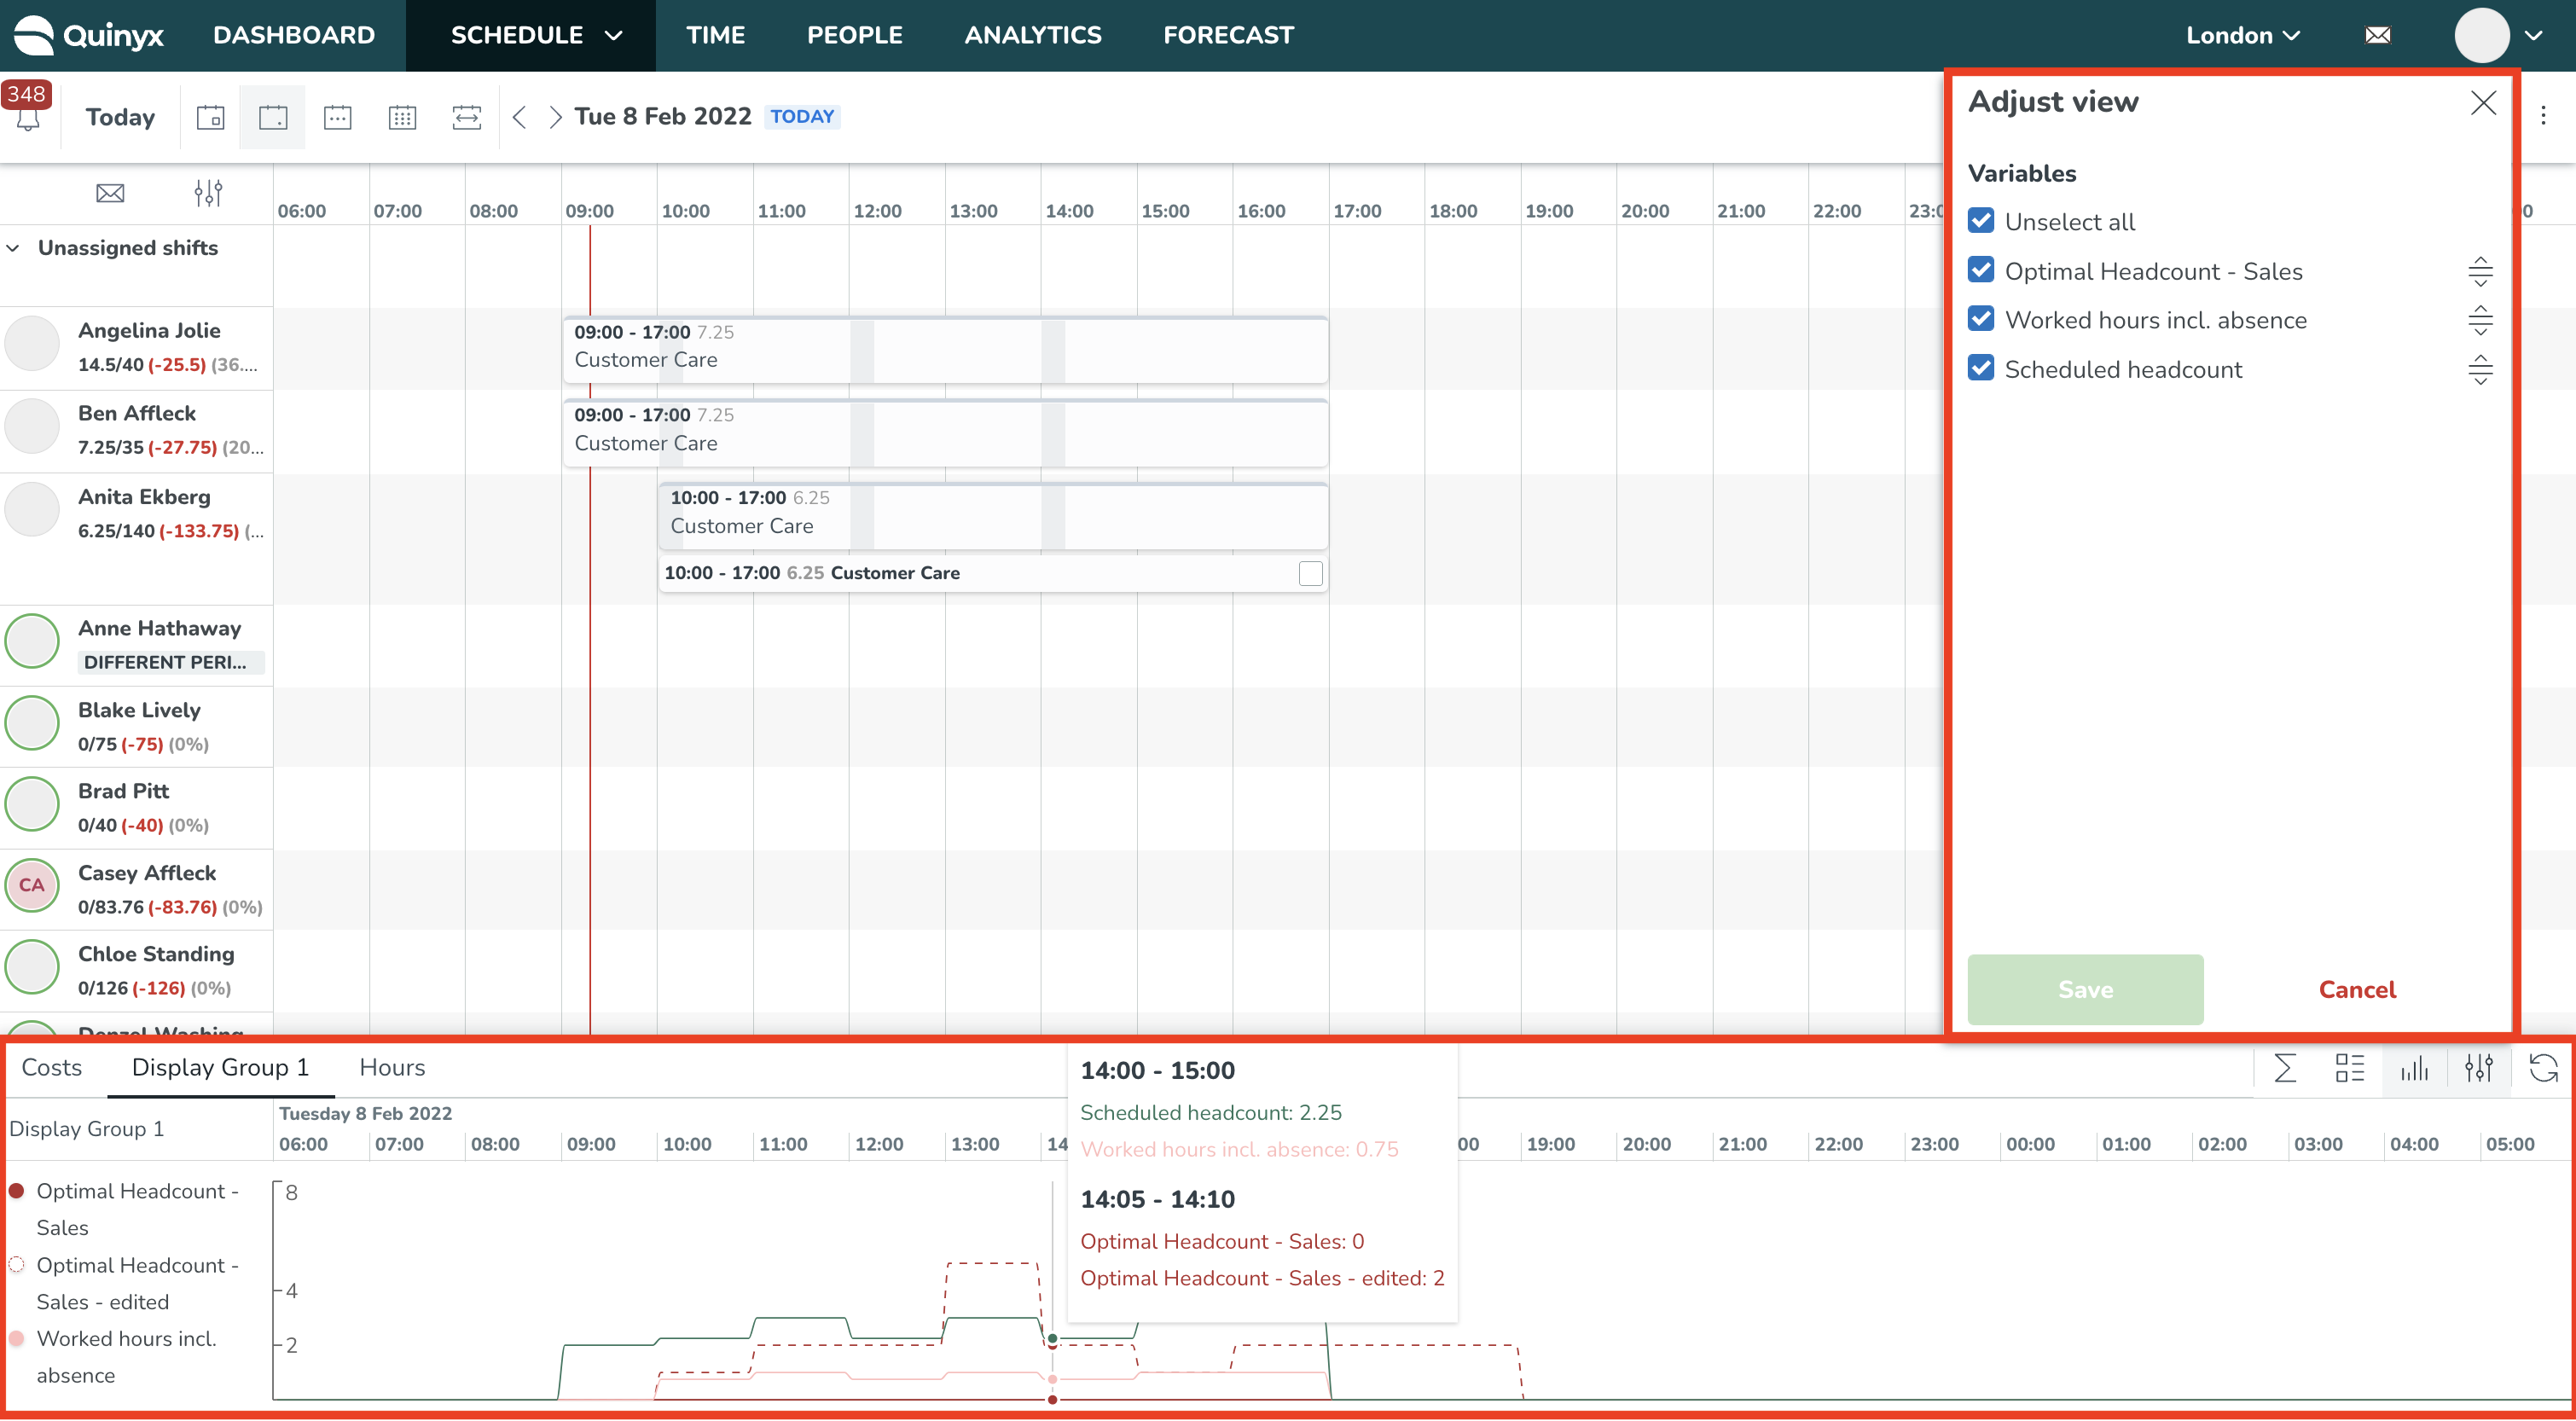
Navigate to Schedule and click on the Statistics icon.

This will turn on the statistics panel at the bottom of the page where you can show your display groups and turn off/on individual variables such as optimal headcount.
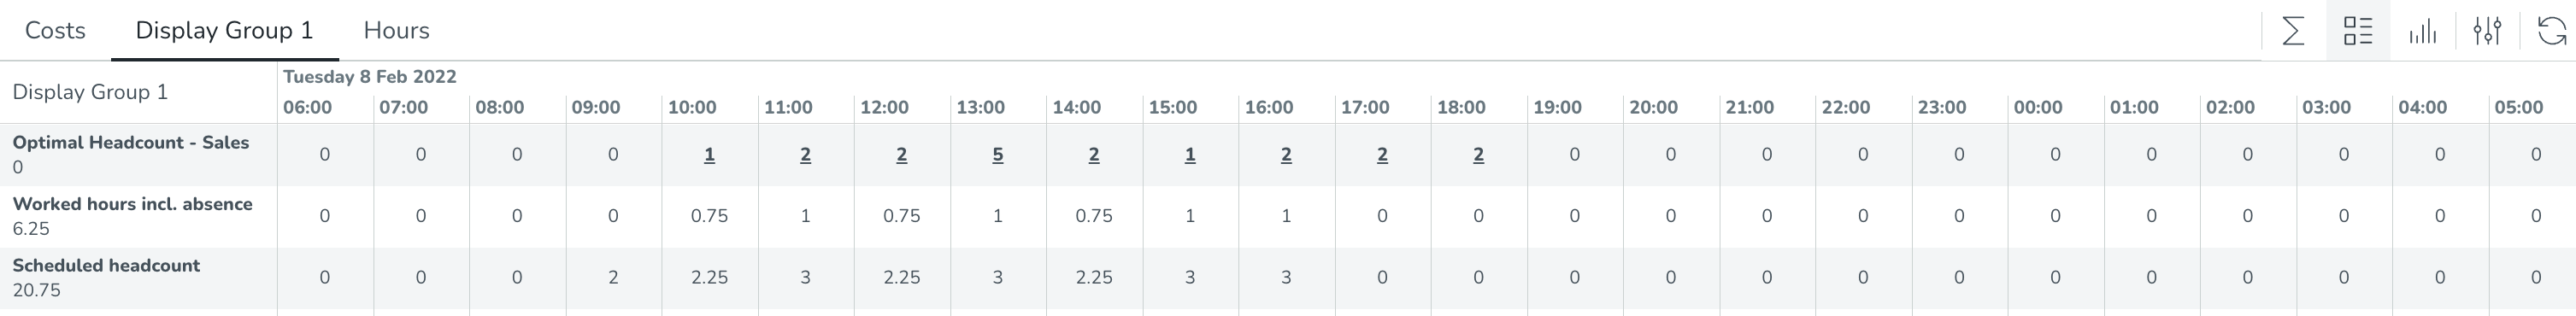
Optimal headcount will be displayed in both a table and graph format.
Forecast graph and tables
You can also view Optimal Headcount on the Forecast graph and tables in the Forecast tab. You can enable visualizing optimal headcount variables by adding them to the correct display groups and turning on visualization for Forecast.