Advanced Analytics - Forecast data dashboards
Introduction
This article will cover the value and insights you can achieve by using the Advanced Analytics Forecast data dashboards when tasked with making informed decisions based on comprehensive data over different groups and extended periods for your organization.
The article also briefly goes over the purpose of each dashboard, as well as the different use cases between the already established Forecast data solution available via Schedule Statistics and the Forecast tab vs the Advanced Analytics Forecast data dashboard solution.

How does it work?
Designed to provide comprehensive visibility into forecast demand patterns on an aggregate and global scale, the Advanced Analytics Optimization module is a powerful tool for understanding and optimizing your workforce planning and operational efficiency. It is divided into two primary dashboards:
The Upcoming Forecast Demand dashboard is designed to give you a clear and actionable visualization of projected demand over the next time period based on historical sales data from previous periods on a broader organizational level.
One of the key features of this dashboard is its ability to help identify outliers—data points that significantly deviate from established trends. These outliers may signal an anomaly or a need for further investigation, providing actionable insights that can be addressed quickly.
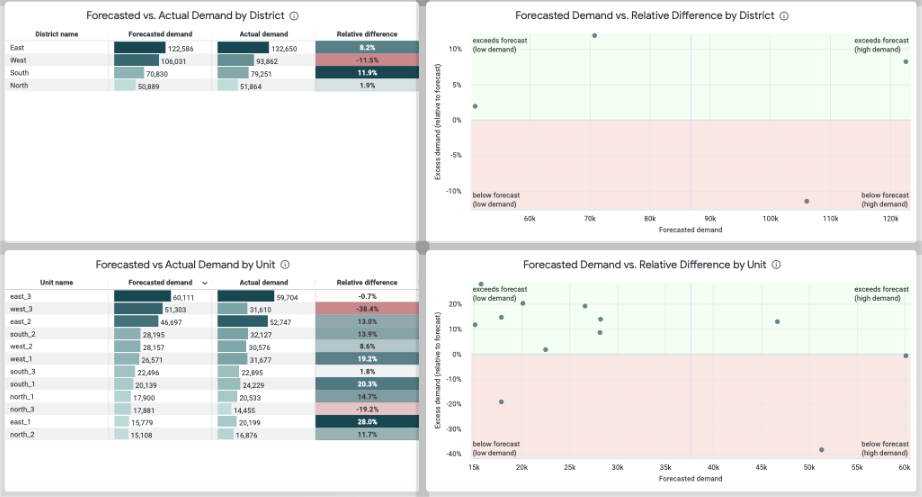
The Historical Forecast Accuracy dashboard is crafted to provide a clear and actionable visualization of your forecasting performance over past periods. This dashboard enables you to assess how accurately your forecasts have aligned with real-world outcomes.
In terms of actionable insight, the Historical Forecast Accuracy dashboard serves as a vital tool for continuous improvement. It not only helps you monitor past forecasting performance but also equips you with the insights needed to make informed adjustments when looking at your data on a broader organizational level. This ensures that your demand planning becomes more accurate over time, driving better decision-making and operational efficiency across your organization.
Each of these dashboards serves a distinct purpose, offering key metrics and insights to help your organization make data-driven decisions, reduce forecasting errors, and align resources more effectively with actual business needs on an organizational level. The insights available are particularly valuable for identifying trends, spotting discrepancies between predicted and actual demand, and improving the overall accuracy of forecasting models.
Breaking down Advanced Analytics Forecast dashboards
The Advanced Analytics Forecast dashboards enable insights for your forecast data, which can be used in combination with the existing insights (in the different touch-points) to provide a broader level of analysis for user groups within Quinyx. It allows users to identify underperforming units, spot peaks in demand, and analyze trends over time.
To break it down on a high level, the insights with Advanced Analytics Forecast dashboards add:
- District and Global-Level Analysis: broadening the insights available from unit-level to district or global levels, allowing more centralized users to assess and compare overall performance and trends across multiple units.
- KPI Dashboards: Introduction of high-level KPIs to capture and monitor trends, such as scheduling accuracy improvements across the organization.
It enables you to start building strategic and actionable insights around:
- Forecasting Accuracy: Users can measure and compare forecasts' accuracy versus actuals at a higher level, identifying variances and trends across different units and groups.
- Actionable Insights: The system will highlight discrepancies between AI-generated schedules and actual outcomes, enabling data controllers to investigate and address issues systematically.
- Trend Analysis: Advanced Analytics Forecast dashboards will allow users to track and compare performance metrics over time, providing a clear picture of improvements or declines in scheduling accuracy, sales, and other critical metrics.
On a more “philosophical” level, Advanced Analytics enables central administrators or data controllers to maximize strategic and operational efficiency. That includes:
- Simplified Monitoring: Centralized users will have access to a unified dashboard that simplifies the process of monitoring multiple units, eliminating the need to compare data across various sources manually.
- Confidence in AI: By providing detailed insights into forecasting accuracy and the reliability of AI-generated schedules, the Advanced Analytics forecast data dashboards aim to build trust in automated processes and support a gradual shift towards AI-driven decision-making.
Unlocking Actionable Insights
The Advanced Analytics Forecast data dashboards aim to unlock a series of actionable insights for our end users. On a high level, this can be defined as:
- Identify Underperforming Units:
- Highlight units that consistently underperform in comparison to the forecast. These are potential areas for investigation to determine if underlying issues affect their performance.
- Spotting Peaks in Demand:
- Detect spikes in demand for specific units during certain periods. This helps assess whether additional resources, like agency workers, are needed to handle temporary surges.
- Trend Analysis Over Time:
- Analyze trends across units over time to identify any changes in processes or external factors that are impacting forecast accuracy, either positively or negatively. This insight helps pinpoint where operational adjustments are needed to improve overall forecast quality over time.
Forecast vs Advanced Analytics Forecast dashboards
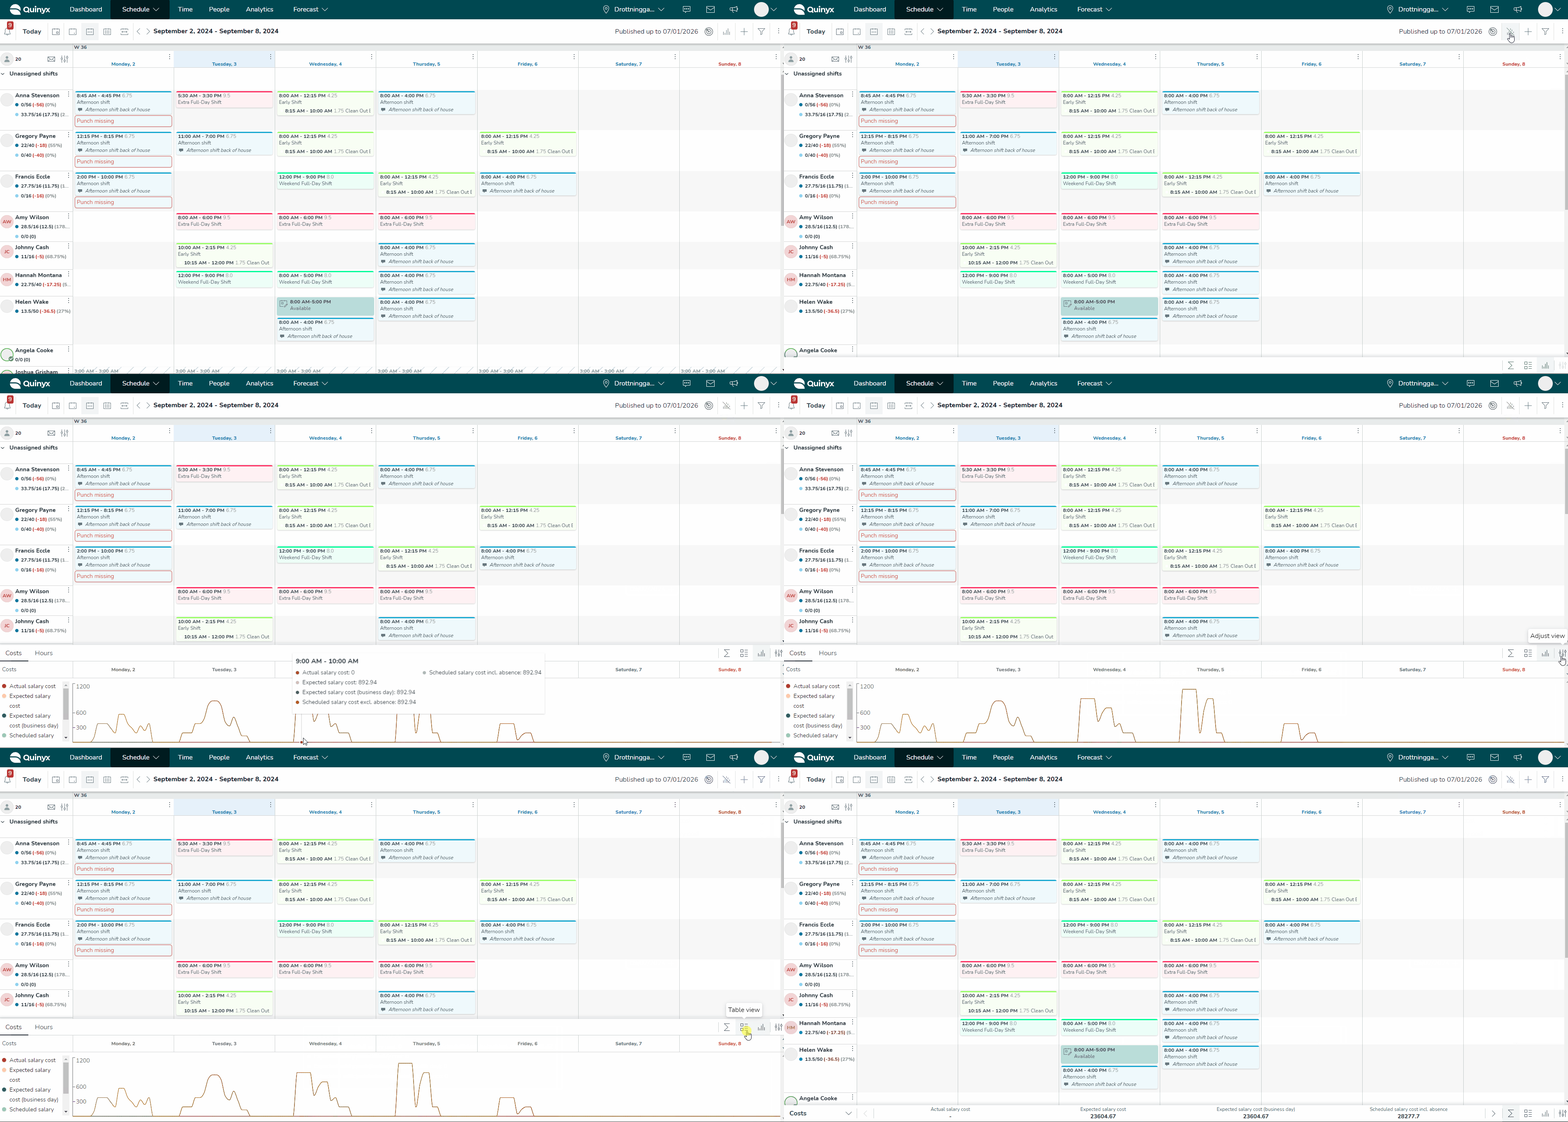
The Advanced Analytics Forecast data dashboards are designed to complement the existing forecast insights available today, such as the Schedule Statistics and the Forecast tab. The latter are designed to cater to immediate operational needs. As such, the analysis of forecast data and its insights found in Schedule statistics and the Forecast tab in Quinyx are restricted to a unit-level view.
- Schedule Statistics: Users can visualize actuals vs. forecasts for various drivers, adjust real-time forecast values, and analyze headcount needs based on sales and transaction impacts. However, this is confined to unit-level views.

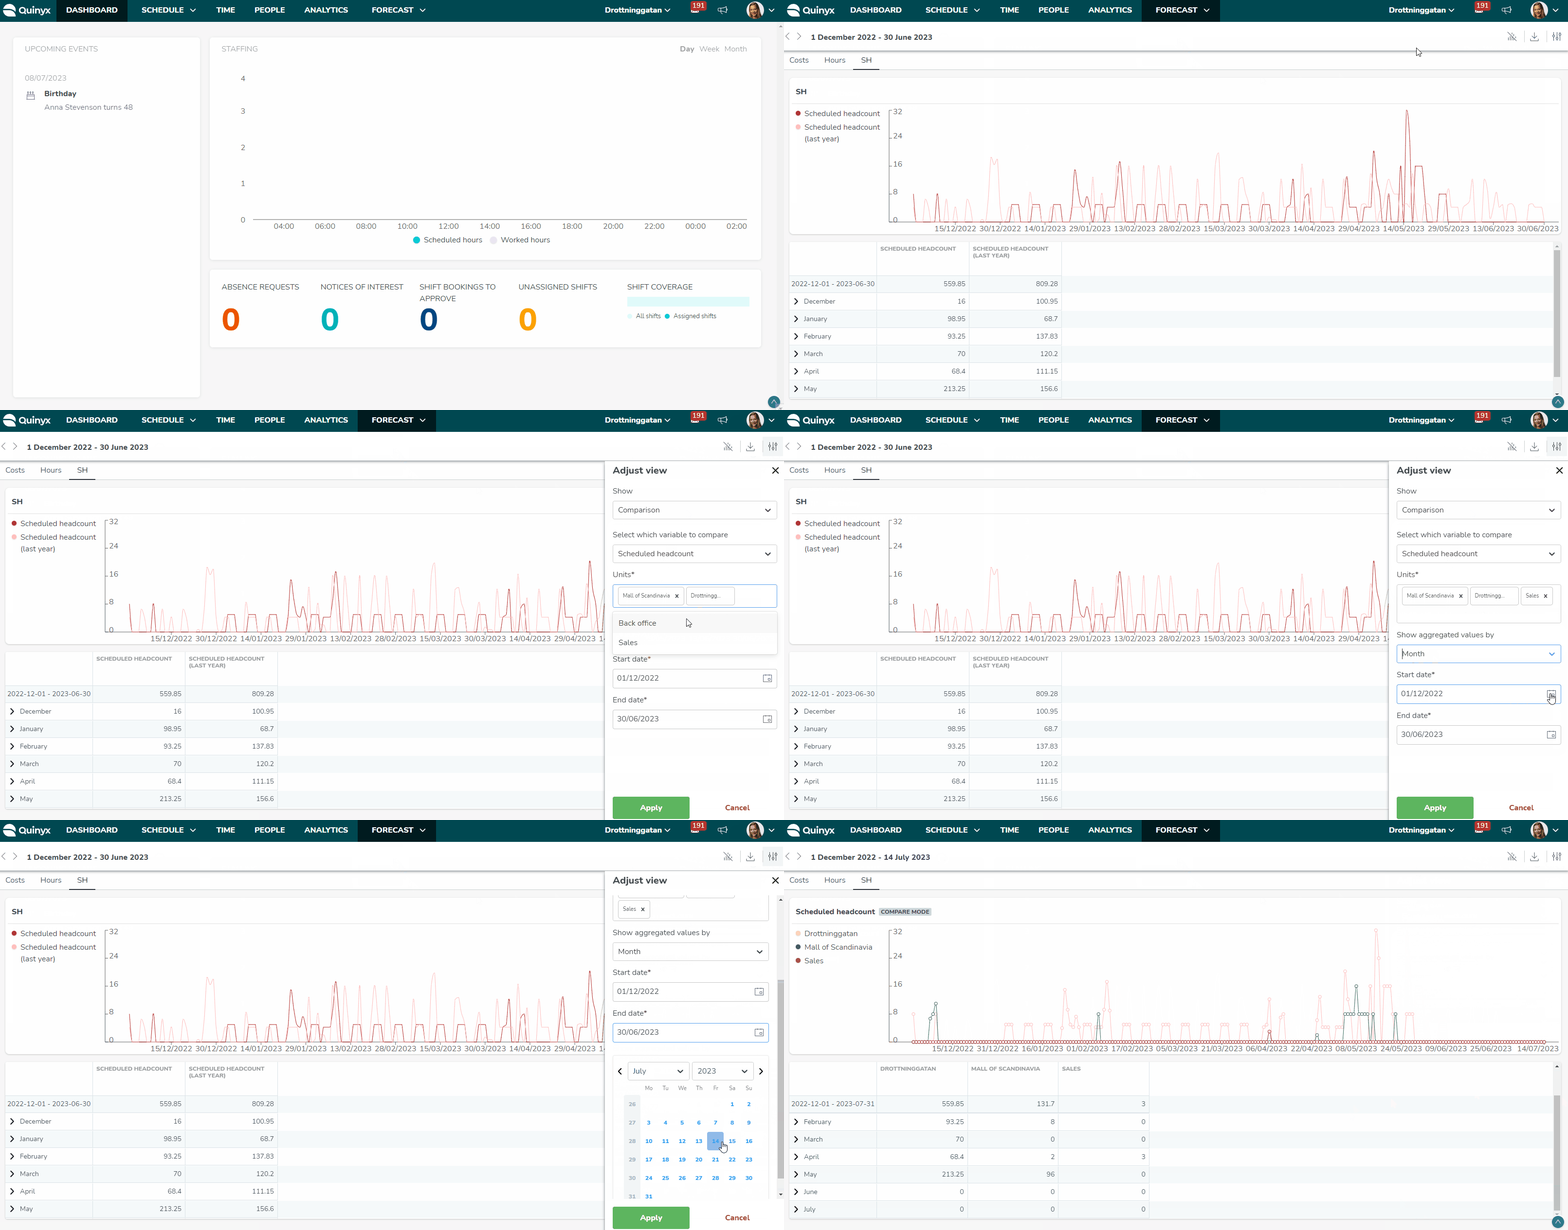
- Forecast tab: Allows users to manage and view forecasts on a broader time scale, such as for the upcoming month, including historical comparisons. It also visualizes events that might impact forecasts, like holidays. Again, the view is limited to individual units.

These tools enable unit managers to make quick adjustments based on real-time data, ensuring that daily schedules align closely with forecasted sales and transactions. The Forecast tab does allow for event-based forecasting and offers a larger-scale view of upcoming periods, but it confines the analysis to individual units.
Strategic insights but on a broader scale
One of the main strengths of the Advanced Analytics Forecast data dashboards is that they provide the broader, strategic insights that higher-level data controllers require. These users are interested not just in what is happening at a single unit but in understanding the overall health and accuracy of the forecasting data across their entire organization. They need to identify trends, discrepancies, and patterns that may indicate underlying issues with the forecasting process or the performance of specific units.

For instance, while the Forecast tab does allow for event-based forecasting and offers a larger-scale view of upcoming periods, it still confines the analysis to individual units. This limitation means that even though managers can prepare for events like holidays or promotions, they lack the ability to assess how these forecasts impact the business at a district or global level. Consequently, higher-level stakeholders are left without the necessary insights to trend this data in the right direction or to make informed decisions that could optimize operations across multiple units.
In summary, the insights available in Quinyx via Schedule Statistics and the Forecast tab are well-suited for day-to-day operational adjustments at the unit level but are insufficient for strategic, high-level analysis.
If you're looking for broader strategic insights, this is where Advanced Analytics can make a significant difference, offering data controllers and district managers the tools they need to monitor, analyze, compare, and improve the overall performance of their organization rather than just focusing on isolated units.

