Version 0054
Dashboard
The purpose of the dashboard is for it to provide you with status updates and visualizations of a selection of Quinyx measures and information. These are divided into four widgets by type of information displayed. The data displayed are for the district, unit or section selected in the group selector. The four widgets are:
- Upcoming Events
- Staffing
- Scheduling (NB: widget heading missing)
- Sales
Upcoming Events
The “Upcoming Events” widget contains information regarding various happenings about to occur, sorted on occurrence in time with the events closest in time appearing first in the list. The following item categories are retrieved from Quinyx and displayed in this widget:
- Birthdays
- Skill expiries
- Agreement expiries
- Shift bookings of unassigned shifts
- Shift swap requests
- Notices of interest
- Leave applications
Depending on your access rights, only items belonging to some of the above categories may be displayed. Please note this widget displays items for the upcoming four weeks (28 days).

Staffing
It is possible to set this widget to display data for the current day, week or month. The widget contains two features, namely a chart displaying scheduled hours in relation to worked hours as well as a staffing optimization bar:
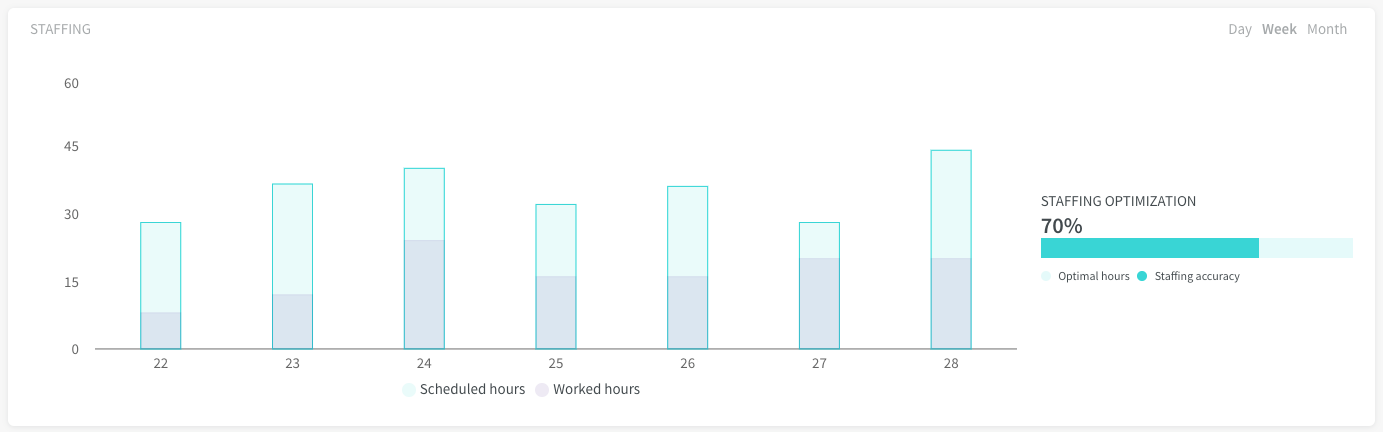
Chart: Scheduled Hours vs Worked Hours
This chart displays scheduled vs grouped hours. Selecting the daily view will show the amount of scheduled and punched hours grouped by hour of the day whereas selecting the weekly or monthly view will show the same data but grouped by day of the week or month respectively.
Hovering on a bar in the chart will bring out a small container specifying the number of scheduled vs punched hours for that hour or day.
Bar: Staffing Optimization
NB: Please note that a “Forecast” module subscription, as well as certain configuration in “Forecast”>”Rules for creation of shifts” in Classic, is required for this bar to be populated with data. See our “Forecast” article for more information.
The staffing optimization bar is an indicator of how close you are to scheduling your staff in accordance with Quinyx’ optimal hours.

This measure looks at how much, on average, you differ from Quinyx’ optimal hours when staffing your unit or section. The 54% score in the screenshot above indicates that, on average, you deviate from your optimal hours by 46% when you schedule any hour of operation of your unit or section.
To expand on the above scenario, a fully green bar with a 100% score will indicate that your staffing is exactly as recommended by Quinyx’ optimal hours. Conversely, a negative percentage and an empty bar indicate that your average difference between optimal and scheduled hours is greater than your average optimal hours:

Please refer to the "Dashboard" article for a more detailed scenario and explanation on how this measure is generated.
Scheduling
NB: For layout reasons, this widget doesn’t have a heading but it’s the widget shown between the “Staffing” and the “Sales” widget:

The widget contains the following information and fetches data for the coming four weeks (28 days):
- Number of leave applications
- Number of notices of interest
- Number of shift bookings to approve
- Please note this is the number of shift bookings and not the number of shifts for which employees have applied. For instance, if there is one shift for which four employees have applied, this will be displayed as four shift bookings and not as one.
- Number of unassigned shifts
- Shift coverage
- The shift coverage displays the proportion of unassigned shifts with regards to all shifts, be they assigned or unassigned. The formula used to calculate this percentage is: (Number of assigned shifts /(Number of assigned and unassigned shifts)) * 100.
Sales
NB: Please note that a “Forecast” module subscription, as well as actual forecast values to have been added in Classic, is required for this widget to be populated with data. See our “Forecast” article for more information.
The “Sales” widget can be set to display data for the current day, week or month. The widget features a chart as well as a progress bar:

Please note that all sales figures in this widget are displayed in the currency defined in “Settings”>”Units”>”Settings” in Classic.
Chart: Forecasted vs Actual Sales
This chart displays forecasted vs actual sales. The actual sales are displayed as bars whereas the forecasted sales are represented by a line with one dot per data point. Selecting the daily view will show amount of actual and forecasted sales grouped by hour of the day whereas selecting the weekly or monthly view will show the same data but grouped by day of the week or month respectively.
Hovering on a bar in the chart will bring out a small container specifying the number of actual vs forecasted sales for that hour or day.
Progress bar: Forecasted vs Actual Sales
This bar shows the progress of your actual sales towards your forecasted sales goal for the selected time period, meaning for the current day, week or month depending on your selection.
A fully green progress bar means you’ve reached your sales forecast. The figures above the bar indicate whether you’ve solely reached the forecast or if you’ve even surpassed it:

A fully blue progress bar means you haven’t made any actual sales yet:

Access Rights
Please see this "Access Rights" article for more detailed information on what access rights are required to be able to view specific “Dashboard” items.
Schedule
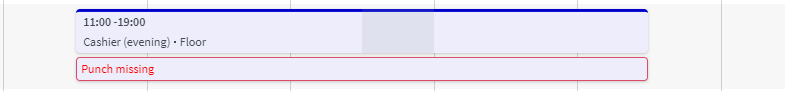
Punch missing
If a shift doesn’t have a punch connected (when looking at past time), a “punch like” box will appear below the shift with text “punch missing” when you select Display > Punches. If the parameter setting “Time missing for a shift” is enabled in Classic > Parameters, a red border will appear as well.
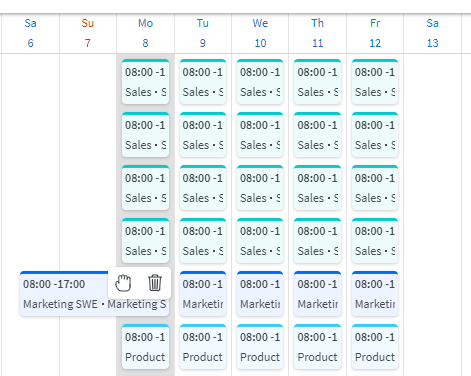
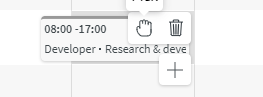
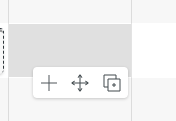
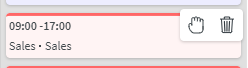
Move and copy shift
Now it's even quicker to move and/or copy shifts compared to last release. In two steps, it's now possible on desktop to move/copy shifts. Hover over a shift, 1) click on the hand icon, go to where you want to move/copy a shift, 2) select either move or copy icon.
Quick actions
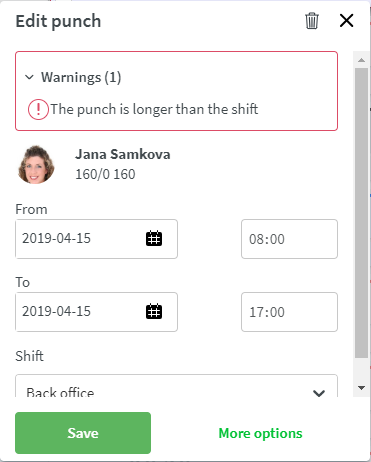
Edit punch
Click on a punch and be able to see warnings on the punch, change the start and end date and time and connected shift.
Delete
Delete shift by hovering over the shift in Schedule and Base schedule.
Size change on shift in longer periods
When you select a longer period it's hard to see all text on a shift (shift type name and start and end time), or if you have a small screen. To mitigate this issue, when you hover over a shift, then the shift will change in size in order to display all shift information.