Event management
 Updated
by
Leigh Hutchens
Updated
by
Leigh Hutchens
- Event categories
- Event configuration
- Event details panel
- Events and optimal headcount
- Events in Pythia and Quinyx
- Automatic Effect calculation introduction
- Annual Events (e.g., Christmas)
- Non-Annual Events (e.g., promotions)
- Creating an Event with Automatic Effect
- Deleting an event with Automatic Effect
- Deleting an Event in the Past Notification
- Deleting an Event in the Future Notification
- Event categories and limits
- Activating Event Categories:
- Event category limits
- Viewing Auto Effect Results
Events are any occurrences that either would result in an increase or a decrease of your forecast values and, therefore, also your optimal headcount values. In Quinyx, you are able to define events and make sure that your forecasts are more realistic also during these special occurrences while in turn, making sure that you schedule according to the correct required headcount.
Event categories
Event categories define and constrict the type of events that managers can create for their districts, units, and sections. It is a way to ensure that the same type of events can be used across the organization. Events cannot be added with any other event category than the ones that have been configured.
Event categories can be defined in Account > Optimization settings > Event categories.
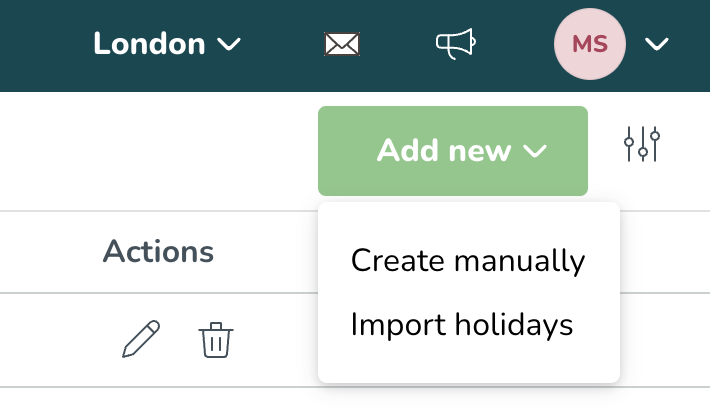
Adding Event categories
By selecting the button Add new, you are able to choose between Create manually or Import holidays. When creating manually, you are adding a Custom event and can choose a name for it. When importing holidays, you are automatically adding categories following a HolidayAPI import. Once an event category is created, it will be automatically added to the Event categories page, and on the Events page it will be possible to create any event based on that category.
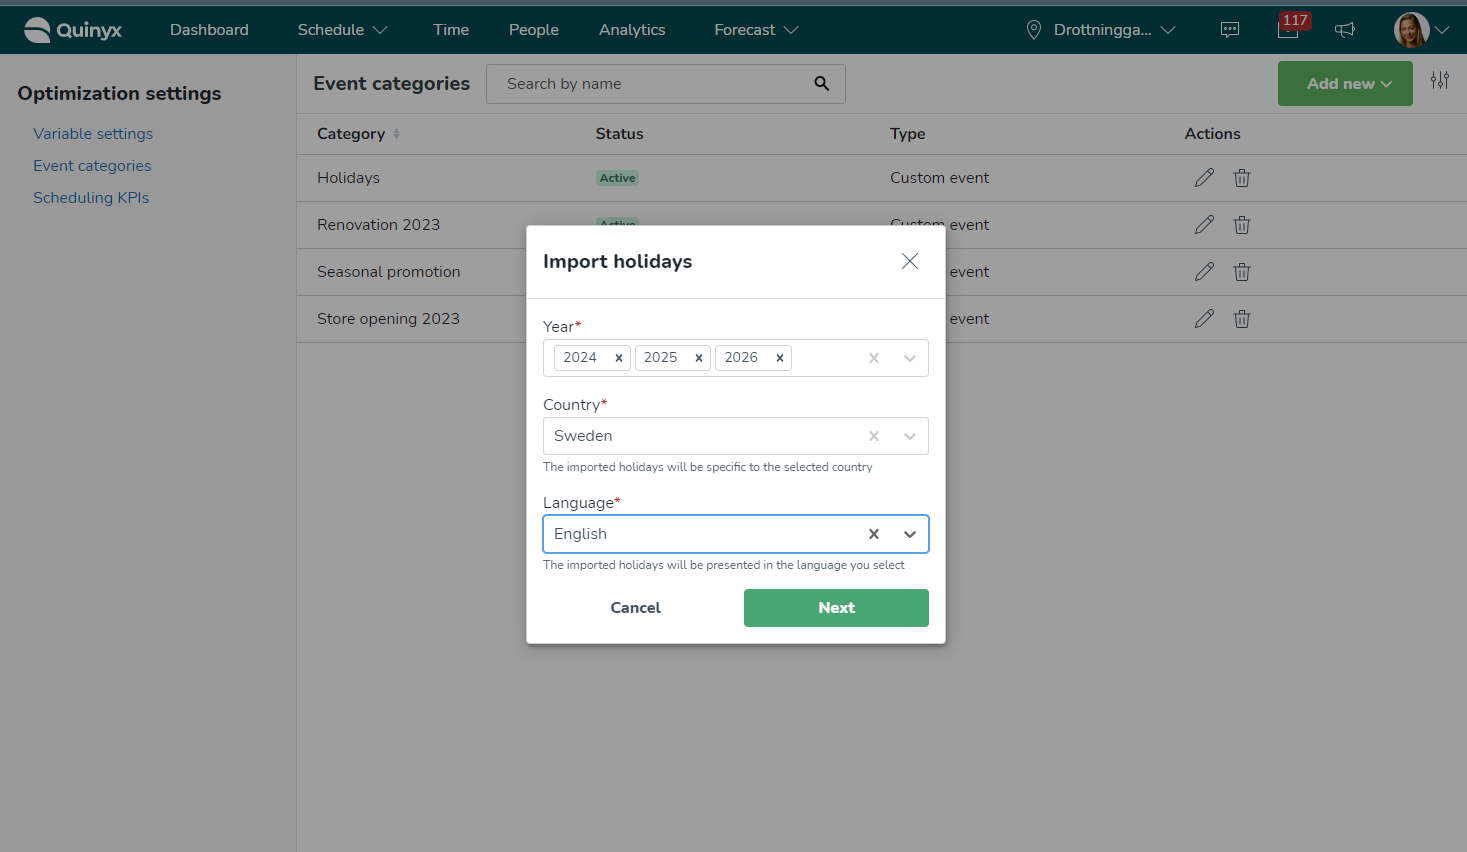
Automatically adding Event categories by importing HolidayAPI
When importing holidays, the following details can be defined in two steps:
Year
Select one or more years you want to import the holidays for.
Country
Select the country you want to import the holidays from.
Language
Select the language you want holidays to be presented in.
Import holidays
Select preferred holidays from the list. You cannot select holidays that have already been imported for the same year.
Once holidays are imported, they will be automatically created as active event categories and added to the Event categories page. In the same time, actual events will be created automatically and added to the Events page (explained in Event configuration part of this article).
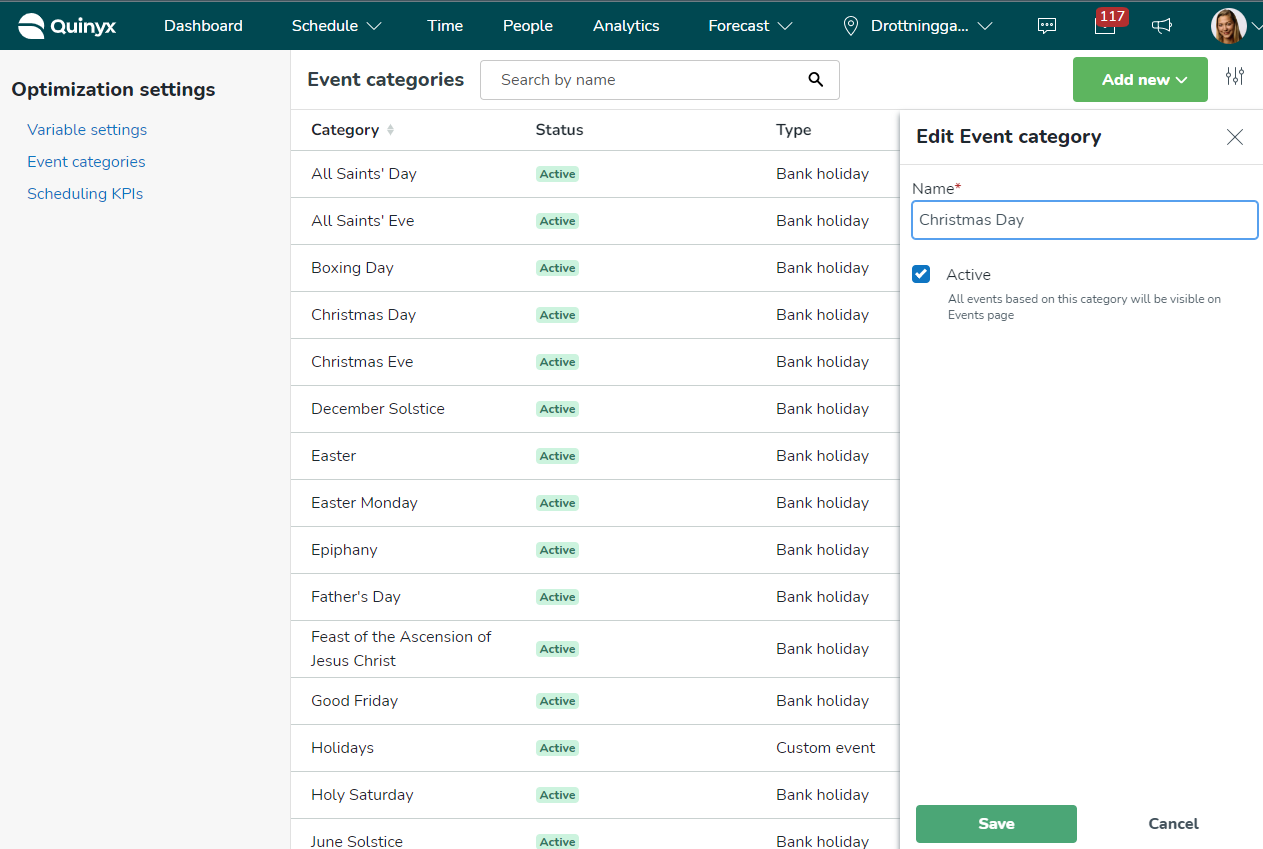
Editing Event categories
You can edit the name of any of the event categories. In addition, you can toggle any of the event categories between active or inactive. Any adjustment made will apply to all events with that event category selected as well as the event category drop-down when adding a new event on the events page.
Deleting Event categories
By selecting the Delete icon, you have the option to delete any event categories created. Only event categories without any events with that selected category can be deleted. If you still want to delete this event category, you first need to delete any events with this event category selected.
Event configuration
Viewing Events
Events can be configured within the forecast tab under Events for all users with write access to Forecast Overview.
The events are visualized based on the selected group in the hierarchy in the events table and the forecast graph and table. As such, when viewing Unit A, you are only able to see events related to Unit A. In order to view events relevant to other units, you need to select a different level in the group hierarchy.
In the events table, all events from the current date and one year ahead are displayed by default. Please use Adjust View to select a custom timeframe.
Per each event, you can view the specific time frame of the event, the configuration, and the group which the event was created for.
In the forecast graph and table, events are also visualized to indicate where within the timeframe the forecast variables are impacted by events. Events are in the forecast graph indicated by a light blue shading within the time period where the event is taking place. Selecting the shading will open up a side panel, including information about the event. This information includes the event category, any potential comments, the period where the event is applicable, and the group for which the event was created.
Hovering over the forecast graph will also include the event below the variables in the view to indicate that there is an active event in the period being looked at.
In the forecast table, a blue dot on last year's variables indicates that an event was taking place on that day the year before. The blue color on the days and hours indicates that an event is taking place in the current time period selected.
Adding Events
Users with write access to Forecast Overview are able to add events. The following details can be defined per Event.
Event category
Selecting an event category is a mandatory requirement. The options in the drop-down are based on the event categories defined in Account > Optimization settings > Event categories.
Comment
Add any comments or additional details relevant to the event.
Select time frame
Selecting a time frame is a mandatory requirement. Select any start and end dates in the future or in the past when the event will take place. Events can be added for full days by selecting All day, or for a part of a day by defining the start and end times.
Select groups
Selecting the relevant group is a mandatory requirement. Events can be added for the whole organization at once, or for specific districts, units, and sections. You can also select multiple districts, units, and sections. The groups available for selection depend on your role and access rights within those groups.
Select variables
Selecting the relevant variables is a mandatory requirement. By default, all variables are selected. Only forecast configuration variables with an external ID defined are possible to select. The variables can either be forecasts created by Quinyx algorithms or forecasts imported through external systems.
Set configuration
Setting the event effect configuration is a mandatory requirement. Events can be configured to increase or decrease the forecast values selected by a specific percentage value or a specific absolute value. The adjustment will be made to every data value on the lowest granularity and not to the aggregated hourly or daily values directly. For example., an event with an absolute adjustment of +10 will increase every data point on for example, a 15-minute level with that value, resulting in a total increase of +40 when looking at the daily aggregation. You can also set the configuration to closed in cases where the group selected is closed during the period of this event, and all forecast values will be set to 0.
Once you save the event, the effect configured will be applied to all variables for the group(s) selected within the specified time frame. E.g., all forecast values for all buckets within a day will increase by 10%. If you have added multiple events for the same time period where one event has a percentage adjustment while another has an absolute adjustment, then the percentage adjustment will be applied first, and the absolute adjustment will be added or subtracted from the new values incorporating the percentage adjustments. This is the case no matter which of the events was added first.
Automatically adding Events from HolidayAPI
Once holidays are imported on the Event categories page and event categories are created, at the same time, actual events will be created automatically and added to the Events page. All events will match the details returned by the HolidayAPI:
Event category
Event categories will match the holiday imported and cannot be changed.
Select time frame
Dates will match the holiday imported and can be changed at any time.
Select groups
Events will be created for the whole organization.
Select variables
By default, all variables are selected and this can be changed at any time.
Set configuration
Configuration will be set to Manual effect with percentage adjustment 0 (zero) as default, which can be changed at any time.
Editing Events
Events can be edited on two different levels:
- Adjustments to the event are applied to all groups within the event.
- Adjustments to the event are applied only to the group you have selected and any groups below.
All groups within the event
If you want edits to the event to apply to all groups for which the event is relevant, the event adjustment must be done at the group level for which the event was created. As such, only managers with access to that group level are able to make changes to the whole group.
For instance, if the event was created for the whole organization, you need to view the events for the whole organization to apply the adjustments.
Only the selected group and any groups below
Suppose an event has been created on a higher group level (e.g., the whole organization), but you want to make adjustments to the event only for a specific district, unit, or section. In that case, you need to make the adjustment on the group level for which you want the adjustment to apply.
Adjustments made on a lower group level will apply to the selected group (e.g., Unit A) and any groups below (Section X, Section Y, and Section Z). The group column in the event table will change to the group for which the overwrite adjustment was made.
Any further adjustments made to the event on the group level for which the event was created will no longer apply to the group (and the groups below) for which the overwrite adjustment was made.
Restoring Event configurations
If an edit has been made to an event on a lower group level (e.g., Unit A) than the group, the event was created for (e.g., the whole organization), a different event configuration applies than the general configuration of that event. It is not possible to delete the event on a lower group level even though the event configuration has changed, since the event still was created on a higher group level. However, by setting the effect of the event to 0% within the manual configuration, the event will no longer impact the forecast levels within the selected group (e.g., Unit 1).
If the adjustment made to the event configuration on a lower group level is no longer relevant, and the general configuration of the event should apply, it is possible to restore the configuration by selecting Restore. Once selected, the configuration will return to the general configuration, and any adjustments made to the event on a higher group level will once again apply to the selected group.
Deleting Events
Once an event is no longer relevant, the event can be deleted on the group level for which it was created. E.g., deleting an event created for a whole District A cannot be deleted when viewing the event on any units or sections within this district, but must be deleted on the district itself. It is therefore impossible to delete events for a higher group level when you only have access to a lower group level. However, by setting the effect of the event to 0% within the manual configuration, the event will no longer impact the forecast levels within the selected group (e.g., Unit 1) while it still impacts the forecast levels of all other levels within the group (e.g., District A).
Once an event has been deleted, it will be removed from all levels within the selected group, including any levels where an adjustment overwrite might have been made. All forecast levels will be returned to the values without the event effect applied.
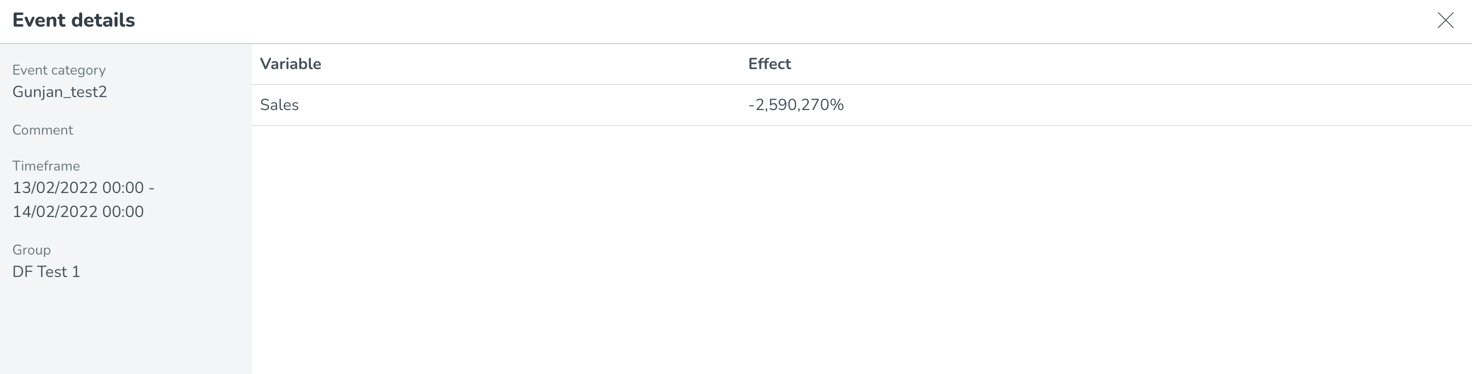
Event details panel
In the events panel, users with read or write access are able to get more details about a specific event. By selecting the event in the Events tab, the panel opens up, and you are able to see:
- The event category selected for the event
- Any relevant comments on the event
- The timeframe of the event
- The group that the event was created for
- Variables impacted by the event
- The effect of the event on the impacted variables is shown either as a percentage value or as an absolute value
Events and optimal headcount
When adding an event that increases or decreases, or sets the forecast values to zero, you also want to ensure that the optimal headcount values are adjusted to match that increase or decrease. Optimal headcounts can be calculated through Quinyx static and dynamic rules, calculated variables, or via the Quinyx labor standard algorithm.
Static rules, dynamic rules, and calculated variables
If you are using static rules, dynamic rules, or calculated variables to calculate your optimal headcount, the event's effect on the optimal headcount will be automatically applied once the effect of the event has increased/decreased the underlying forecast configuration variables. As such, you can ensure that the optimal headcount values are still relevant both with or without events applied to the forecasts.
Quinyx labor standard algorithm
If you are using the Quinyx labor standard algorithm to calculate your headcount based on a Quinyx demand forecast, the effect of the event on the forecast variables will not immediately increase or decrease the optimal headcount values. After you have added an event, you need to rerun the Demand Forecast from Quinyx to apply the effect.
Events in Pythia and Quinyx
If you already have events configured in Pythia (AI Optimization) and want to start using events in Quinyx but ensure that the same event is not applied twice, please reach out to your Quinyx representative. Events can only be used in Pythia (AI Optimization) or in Quinyx.
Automatic Effect calculation introduction
Sometimes it is difficult to know what effects an event can have on a set of data. For example, you may not be able to get an accurate estimation of sales and transactional levels, as this is dependent on the type of event that arises.
With Automatic Effect Calculation, the effects of an event can be seamlessly integrated into the algorithm's computations. Using the Automatic Effect Calculation method, you are instructing the Demand Forecasting algorithm to calculate the effect of significant happenings that affect your data over an extended duration (one day or more) based on historical occurrences of the same type of event.
Below are some examples of different types of events where Automatic Effect Calculation could be valuable:
Annual Events (e.g., Christmas)
Establishing a single event category for an annual event such as Christmas can be set up as an event for each year. If an event is significantly influenced by another, consider omitting that event for the affected year, especially if other years provide a clearer picture.
- Pre-events are lead up times to an event, this mainly affects Annual Events, for example there being a noticeable shift in variable values such as customers purchasing before an annual event like Black Friday or Christmas sales.
- Post events, on the other hand, are wind-down times following an event post events are when variables such as sales continue to fluctuate like the post dip in sales after a major sale event such as the Christmas Sales.
Non-Annual Events (e.g., promotions)
If promotions can be distinctly categorized, and these categories have varying impacts on the data, informing the algorithm of these differences can be advantageous. For example, a 50% discount promotion might have a greater effect than a 20% discount. It is therefore better if you were to categorize the promotions by their discounts.
Creating an Event with Automatic Effect
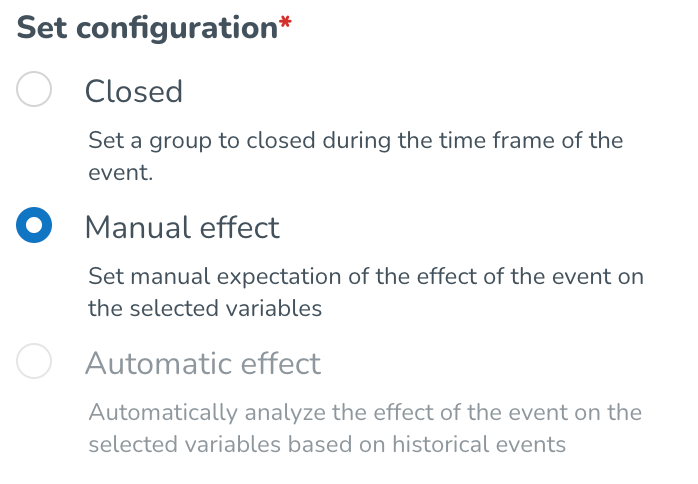
On the Forecast page, you can manage your forecast and events, this includes creating your forecast and having the ability to be able to add events. You have three configuration options when adding an event:
- Closed
- Manual Effect
- Automatic Effect
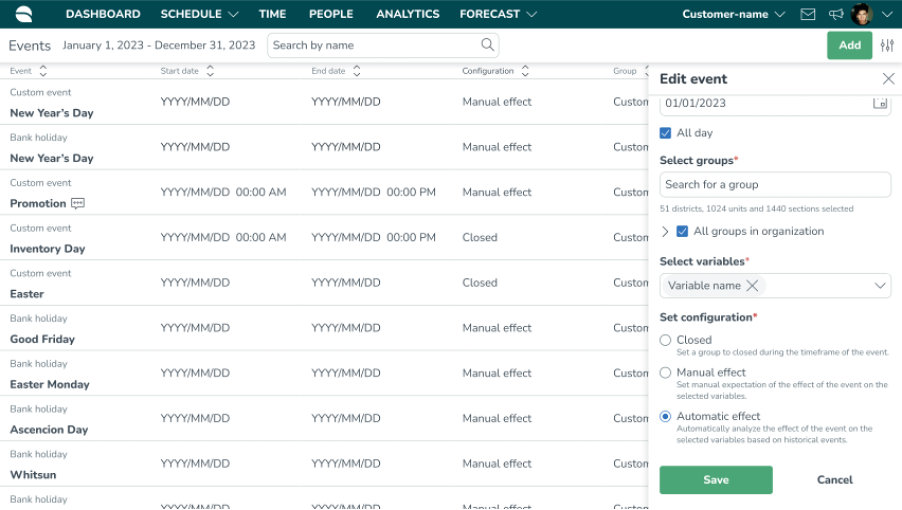
The process is the same when setting up an event with the Manual Effect applied; you will instead be selecting the Automatic Effect option, as displayed in the image below:
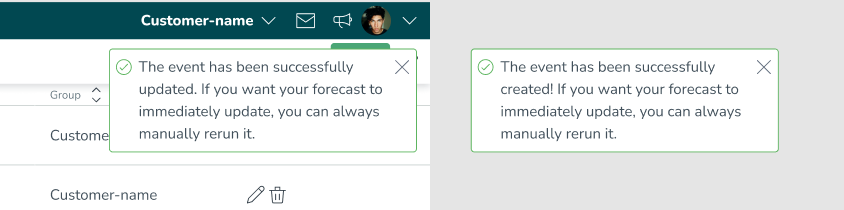
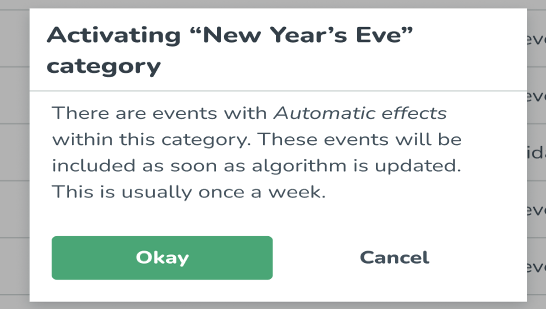
When an event has been created or edited for the first time, you will see either of the below messages:
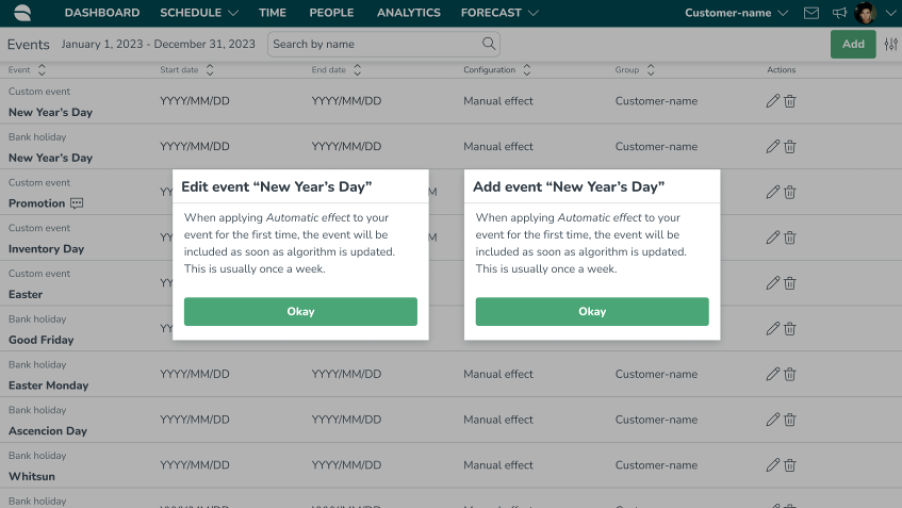
As you can see from the text in the image above, it is stated that the algorithm is generally updated once a week; what this means for you is that when an event has been created or an existing event has been edited until the algorithm has been updated to include those events to base the effect calculation on, you will not see the computed results in your forecast.
This is different from our manual effect calculations, where the event effect is added on top of the forecast immediately, no matter if the forecast is created only once or multiple times.
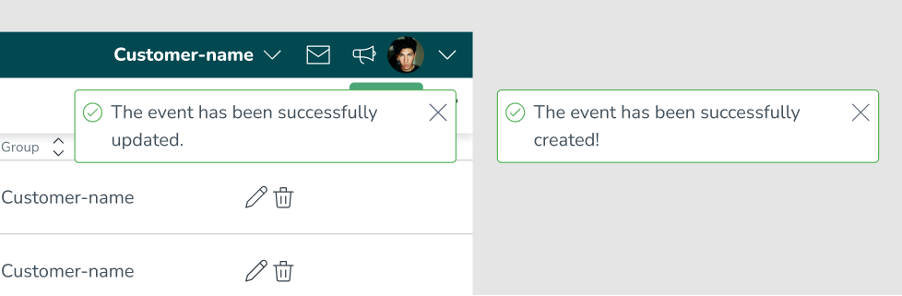
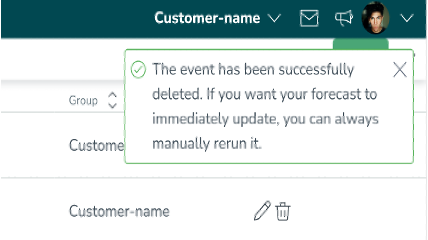
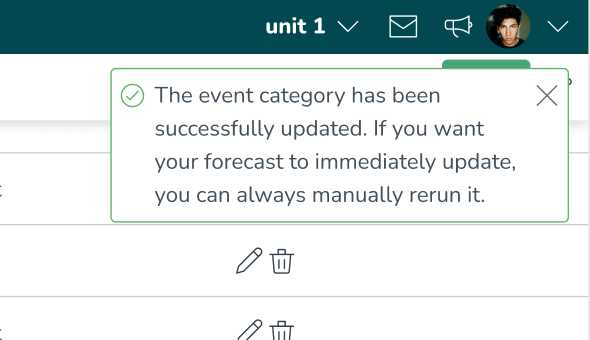
After clicking okay on either option, you will see the following to confirm that the event has either been updated or created:
When creating an event of an existing event category for the second time and more, you will see the following message appear once you have clicked save (This again applies to both updating and creating an event).
This means that the algorithm already includes actual data based on the same event category in the past, and you can simply rerun the forecast for the future period, including the new event, to see the computed results in your forecast.
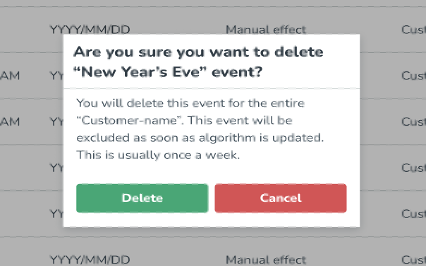
Deleting an event with Automatic Effect
Just as you can add an event, you are also able to delete an event, whether that event is now in the past or set to occur in the future.
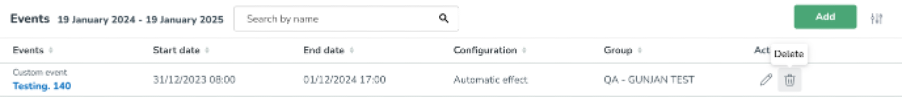
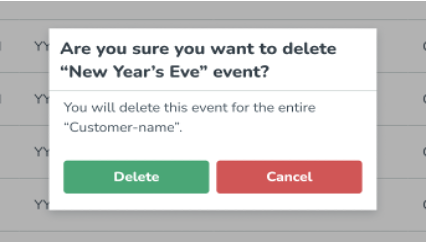
In order to delete an Event, you need to click on the bin icon, as displayed in the image below:
Deleting an Event in the Past Notification
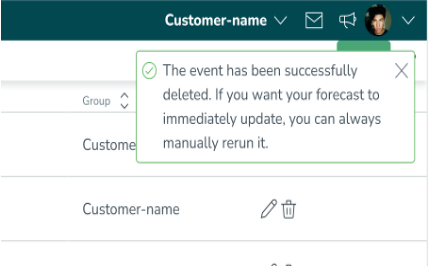
When deleting an event in the past, the actual impact of that event on the forecast is already included in the algorithm and would impact the effect of future events with the same event category. To ensure that the deleted event does not impact future events with the same event category, you need to wait until the algorithm is updated.
You will need to manually or automatically rerun the forecast for the relevant period to ensure that the effect of the event is removed from the forecast directly after deleting the event. This is different compared to events with a manual effect, where this effect will be removed immediately when the event is deleted.
Deleting an Event in the Future Notification
You will need to manually or automatically rerun the forecast for the relevant period to ensure that the effect of the event is removed from the forecast directly after deleting the event. This is different compared to events with a manual effect, where this effect will be removed immediately when the event is deleted.
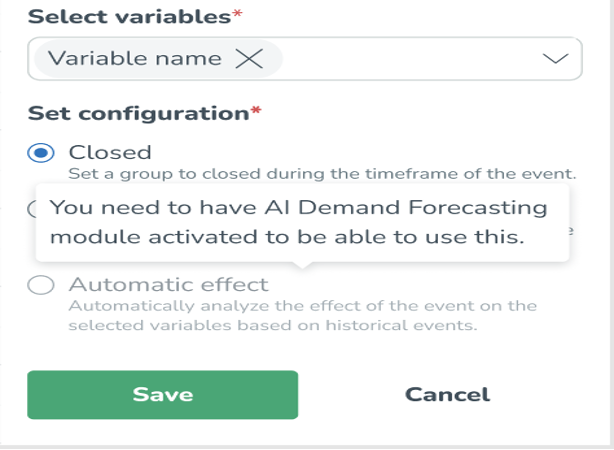
If you do not have our AI demand forecasting tool, you will still be able to use the closed and Manual Effect calculation method but the Automatic Effect option will be greyed out, as seen in the image below:
You will also be notified that you will need to have the Quinyx AI Demand Forecasting tool to use this option in the platform.
Event categories and limits
Inactivating/Activating an Event Category with Automatic Effect
As well as having the option to delete an event, you are able to inactivate and activate event categories (look further up in the article to read more about activating and inactivating. In order to do this, you will need to go to Account > Optimization settings > Event categories.
You can inactivate the category by unchecking the Active box.
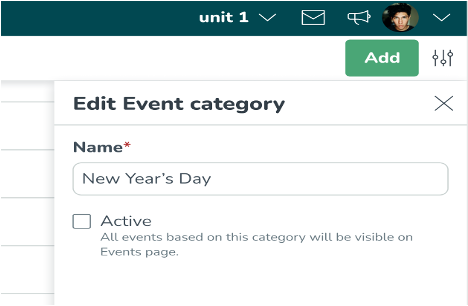
Once you click save, you will see the message below:
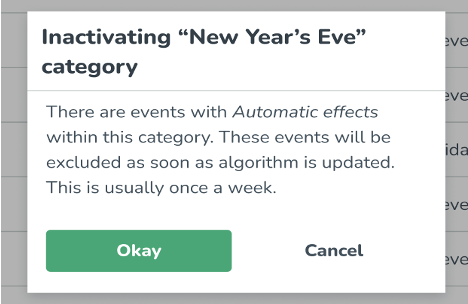
When inactivating an event in the past, the actual impact of that event on the forecast is already included in the algorithm and would impact the effect of future events with the same event category. To ensure that the inactivated event does not impact future events with the same event category, you need to wait until the algorithm is updated.
Lastly, you will then receive a confirmation that the event category has successfully been updated.
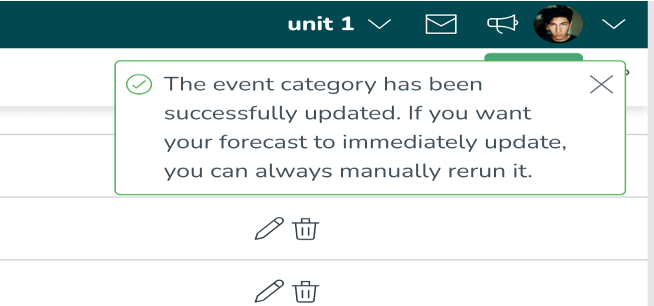
You will need to manually or automatically rerun the forecast for the relevant period to ensure that the effect of the event is removed from the forecast directly after inactivating the event category. This is different compared to events with a manual effect, where this effect will be removed immediately when the event is inactivated.
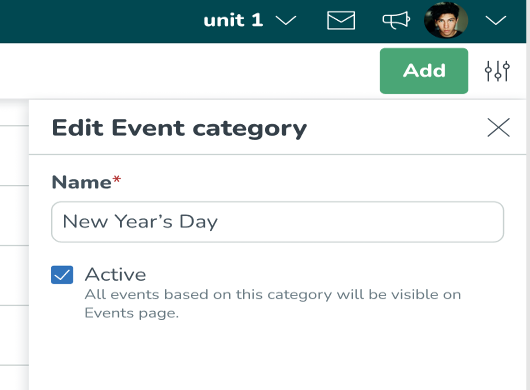
Activating Event Categories:
You can activate the category by checking the Active box.
Once you click on save, you will then be notified.
When activating an event in the past, the actual impact of that event on the forecast has not yet been included in the algorithm and the effect of future events with the same event category cannot be calculated. To ensure that the activated events do impact future events with the same event category, you need to wait until the algorithm is updated.
Lastly, you will then receive a confirmation that the event category has successfully been updated.
Event category limits
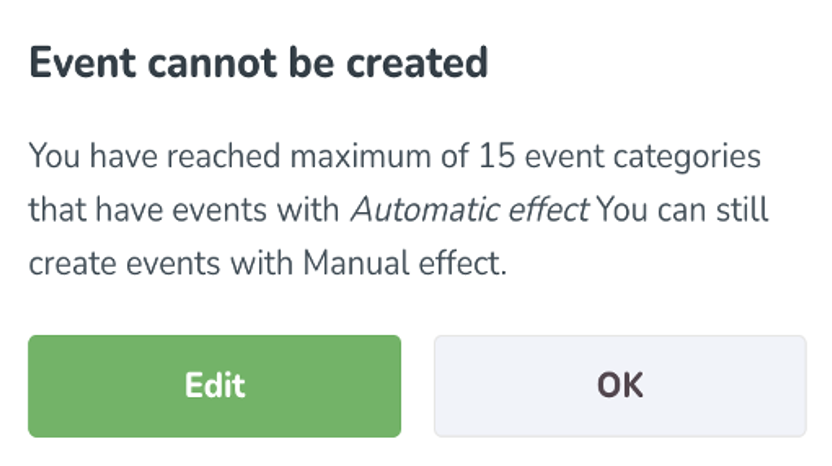
For each event, you are only able to create a maximum of 15 event categories that have events with automatic effect. We have limited allowing a maximum of 15 events with automatic effect assigned to ensure that the computational performance of the demand forecasting algorithm is ensured while they're able to select event categories that are more impactful on their forecast levels. Once you reach the limit of 15 event categories assigned with automatic effect.
You will see the following message appear when you are trying to save an event and have reached the limit of 15 categories:
You will see the following message when attempting to activate an existing category when you have already reached the 15 limit:
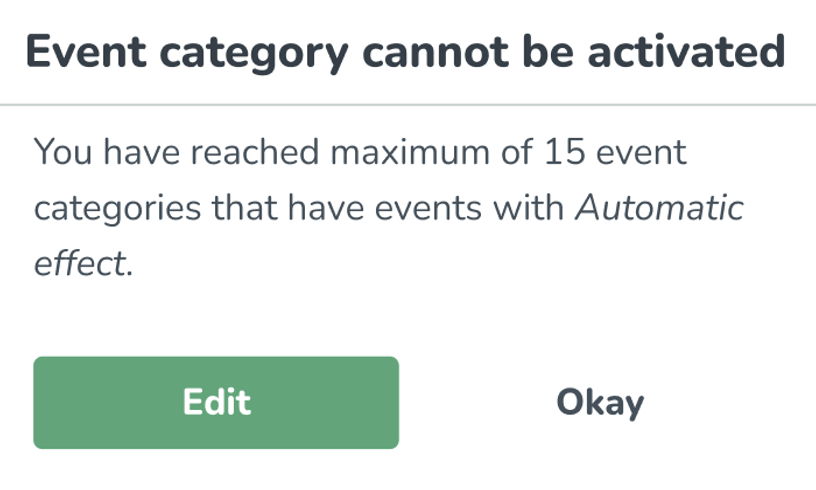
Please do note that you are able to edit existing events if you have reached the 15 limit mark to suit your requirements.
Viewing Auto Effect Results
So you may be thinking, where do I see the results of the event I have created?
With the addition of Automatic Effect Calculation, data from the demand forecasting algorithm will be received per each unique variable. For you, this means that for an event created with multiple districts, units, or variables, you will be shown one single effect per variable per unit/section.
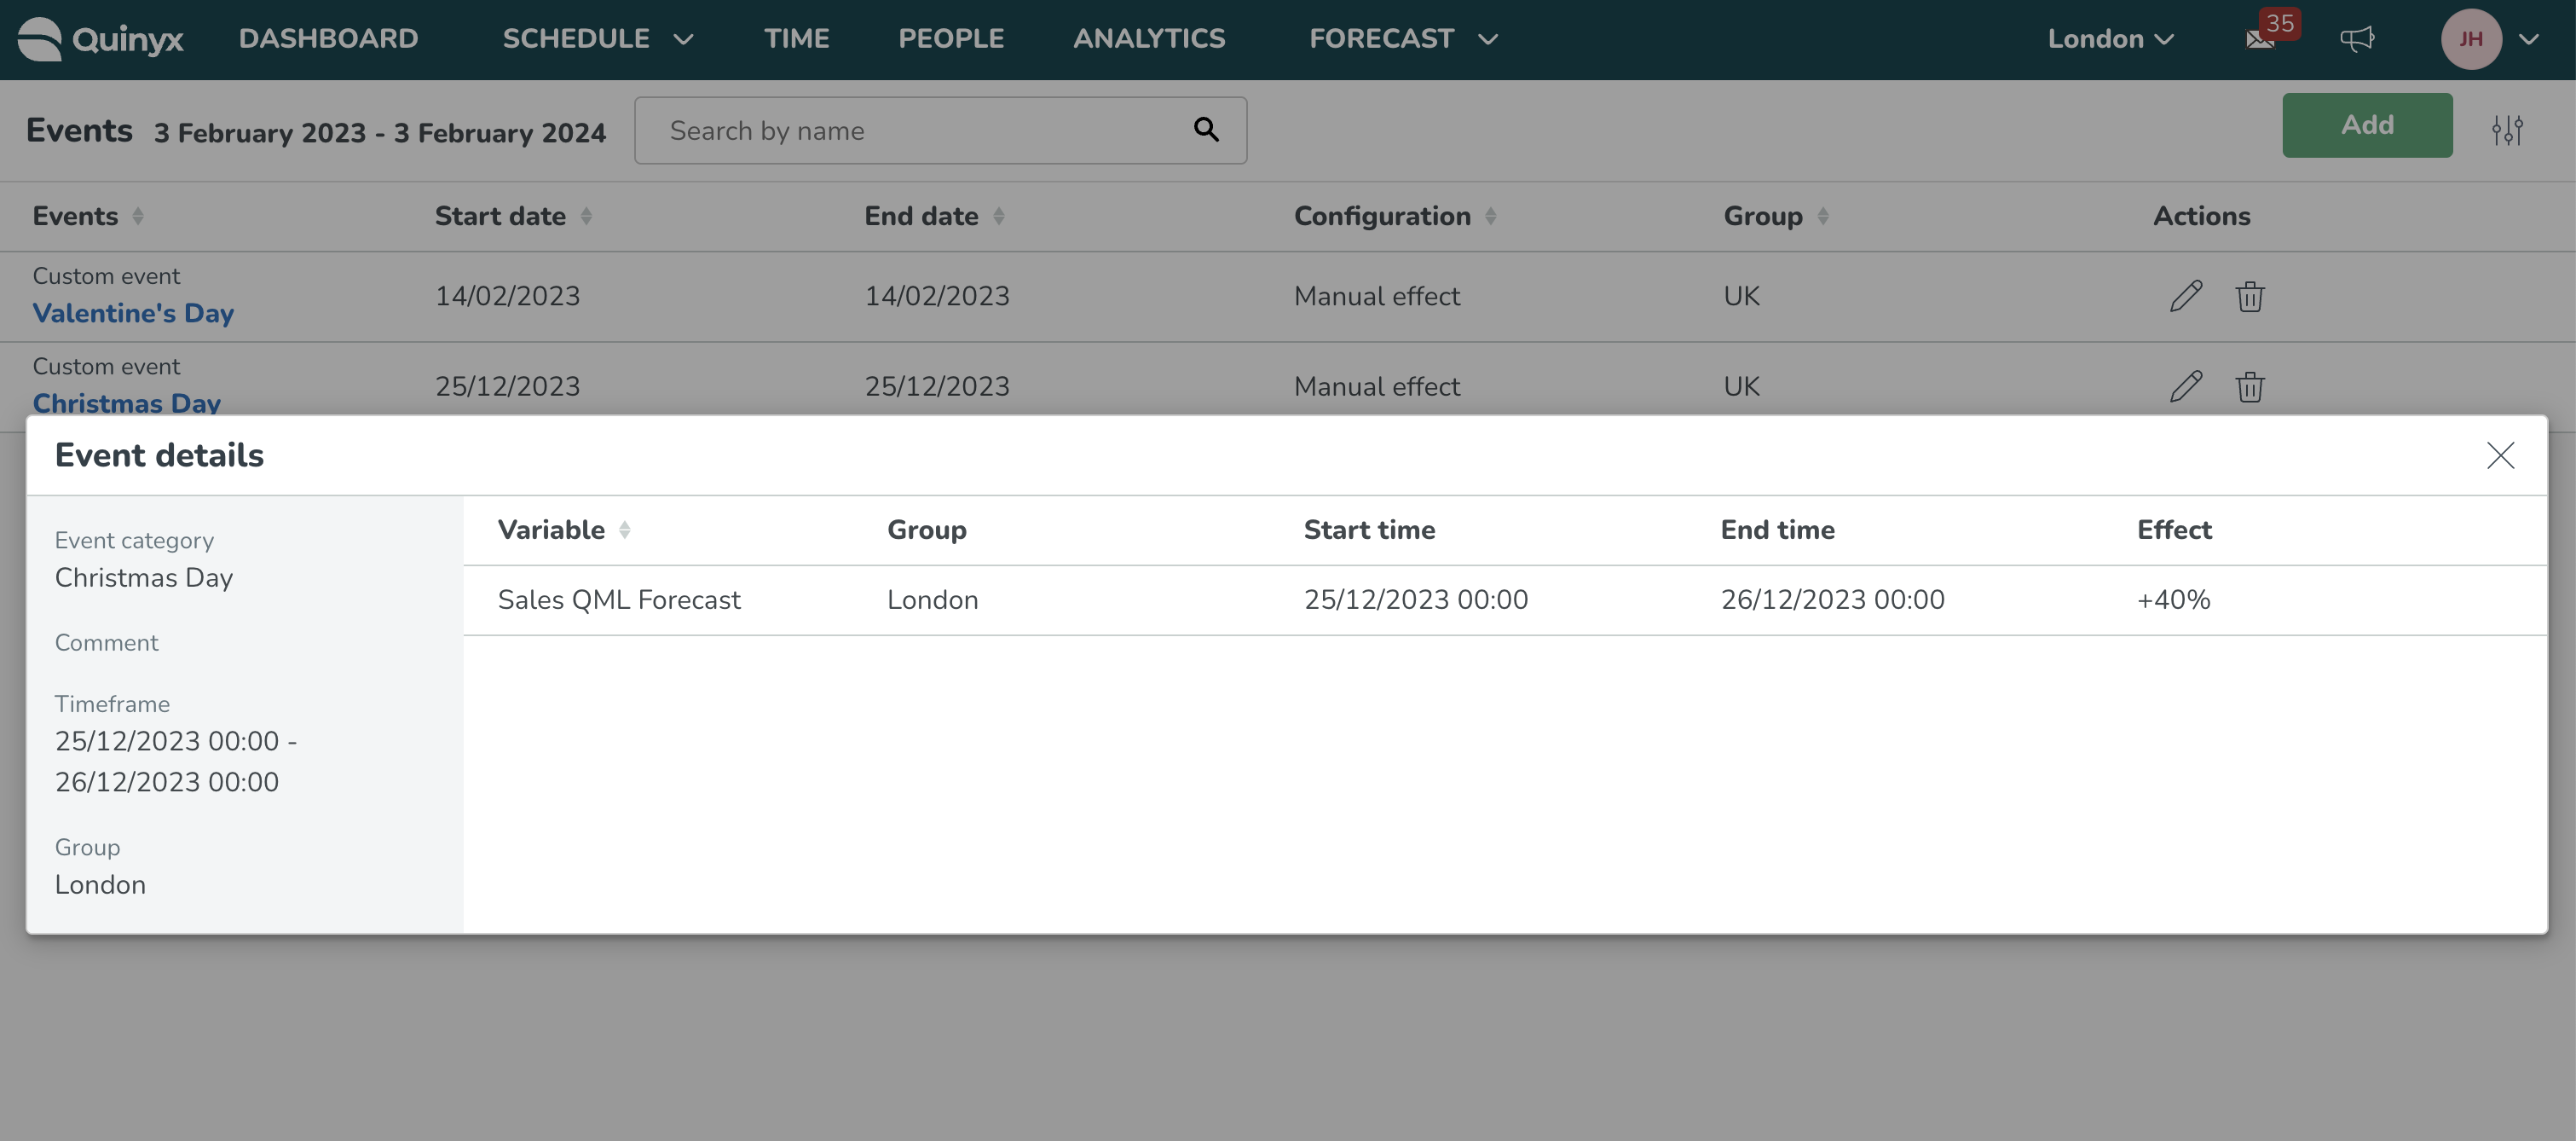
Visualizing the individual event effect percentages will help you understand how the event is going to impact one specific variable on a specific unit, and this can be seen on the Event details panel page.
To get to this view you will need to follow these steps:
Go to Forecast > Events which will take you to the page below:
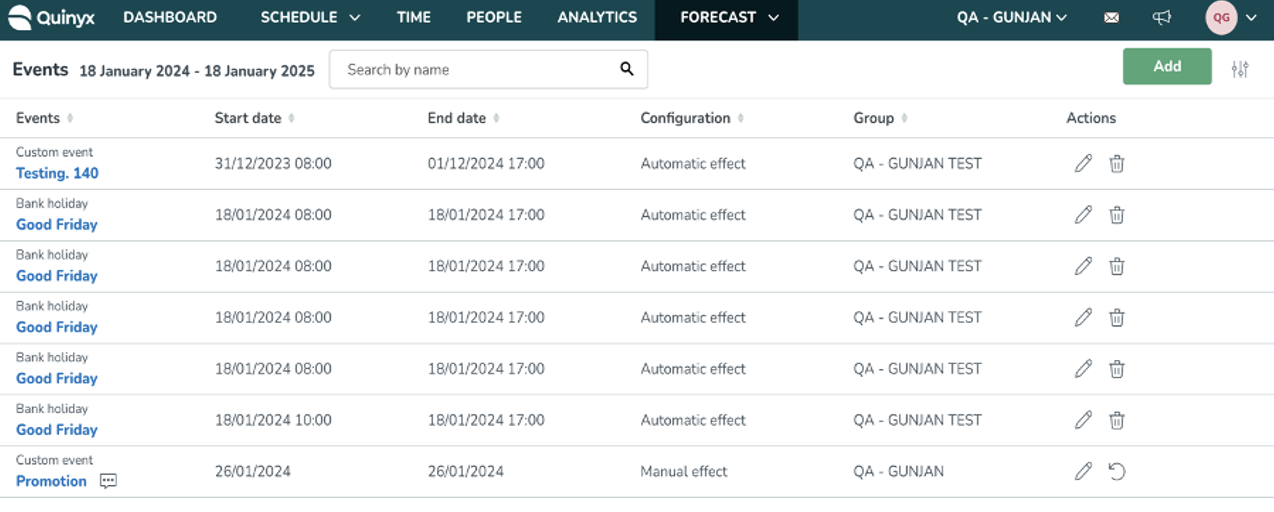
You then click on the event on which you want to view more information, and you will then see the event details as seen below: