Schedule Statistics
 Updated
by
Victor Jespersen
Updated
by
Victor Jespersen
Viewing Schedule Statistics
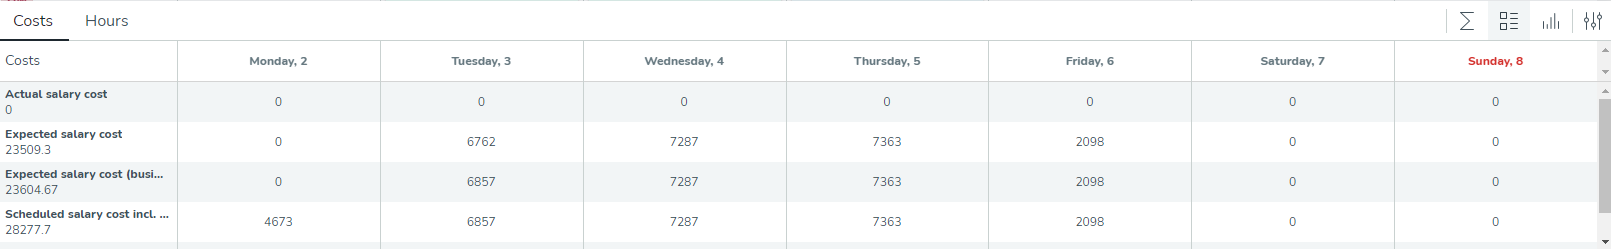
To toggle the statistics panel on or off, click the Statistics icon located on the Schedule tab. This action will show or hide the statistics bar at the bottom of the page. You can also switch to a table view using the icons on the far right.
You can view information in a chart.
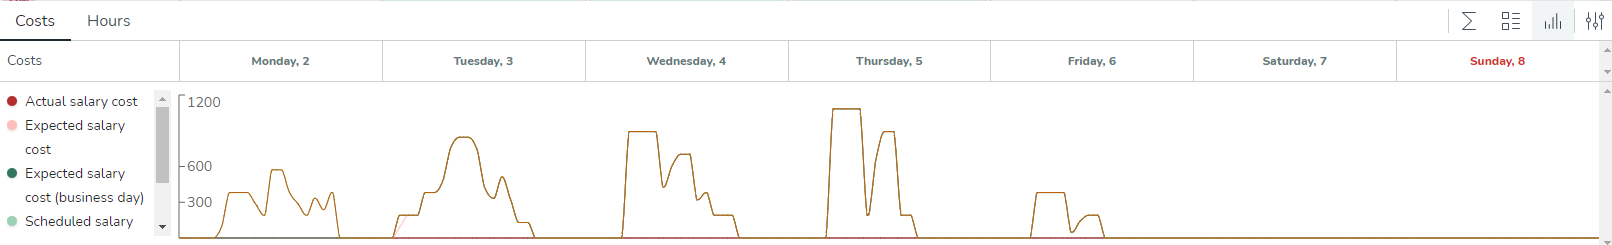
A graph.
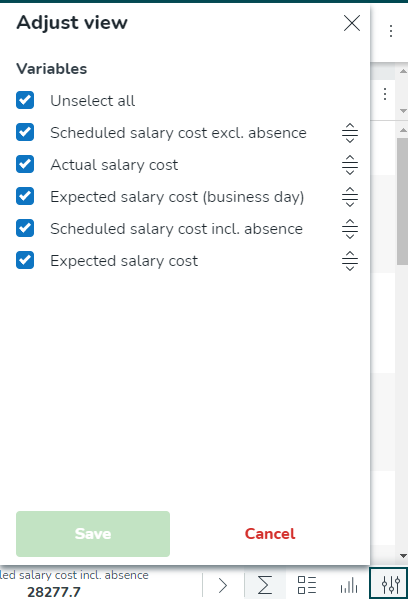
Edit the variables shown in the selected Display Group. You can move the variables to display the way you want them to.
Changes you make in the schedule are immediately updated in schedule statistics, even if you keep schedule statistics open while making those changes. There is no need to click refresh whenever you have made changes in the schedule to ensure that those changes are updated in your data variables.
Using Schedule Statistics
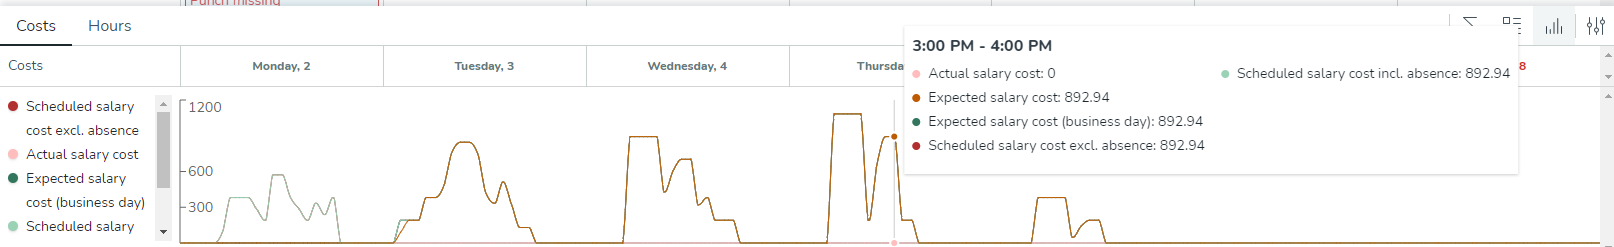
You can hover your mouse over the graph to show individual data points.
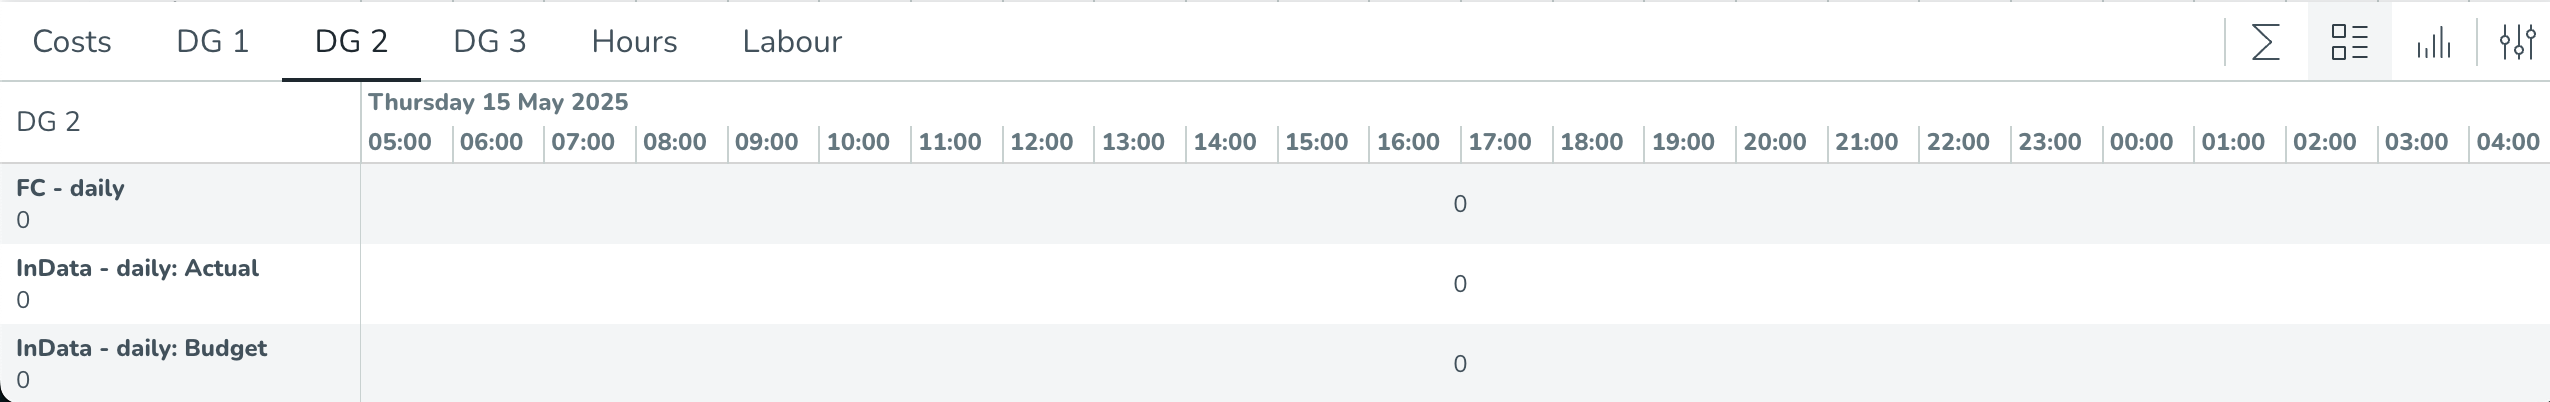
You may see different resolutions. This is based on the settings you have used in your input data. For example, when data with a Daily resolution is imported and you're viewing a single day in the Statistics, you'll see a single value across all of the hours of the day in one merged cell.
In the table view, you can also edit forecast data.
You can click on any time stamp in the future to bring up the edit forecast window as shown below:
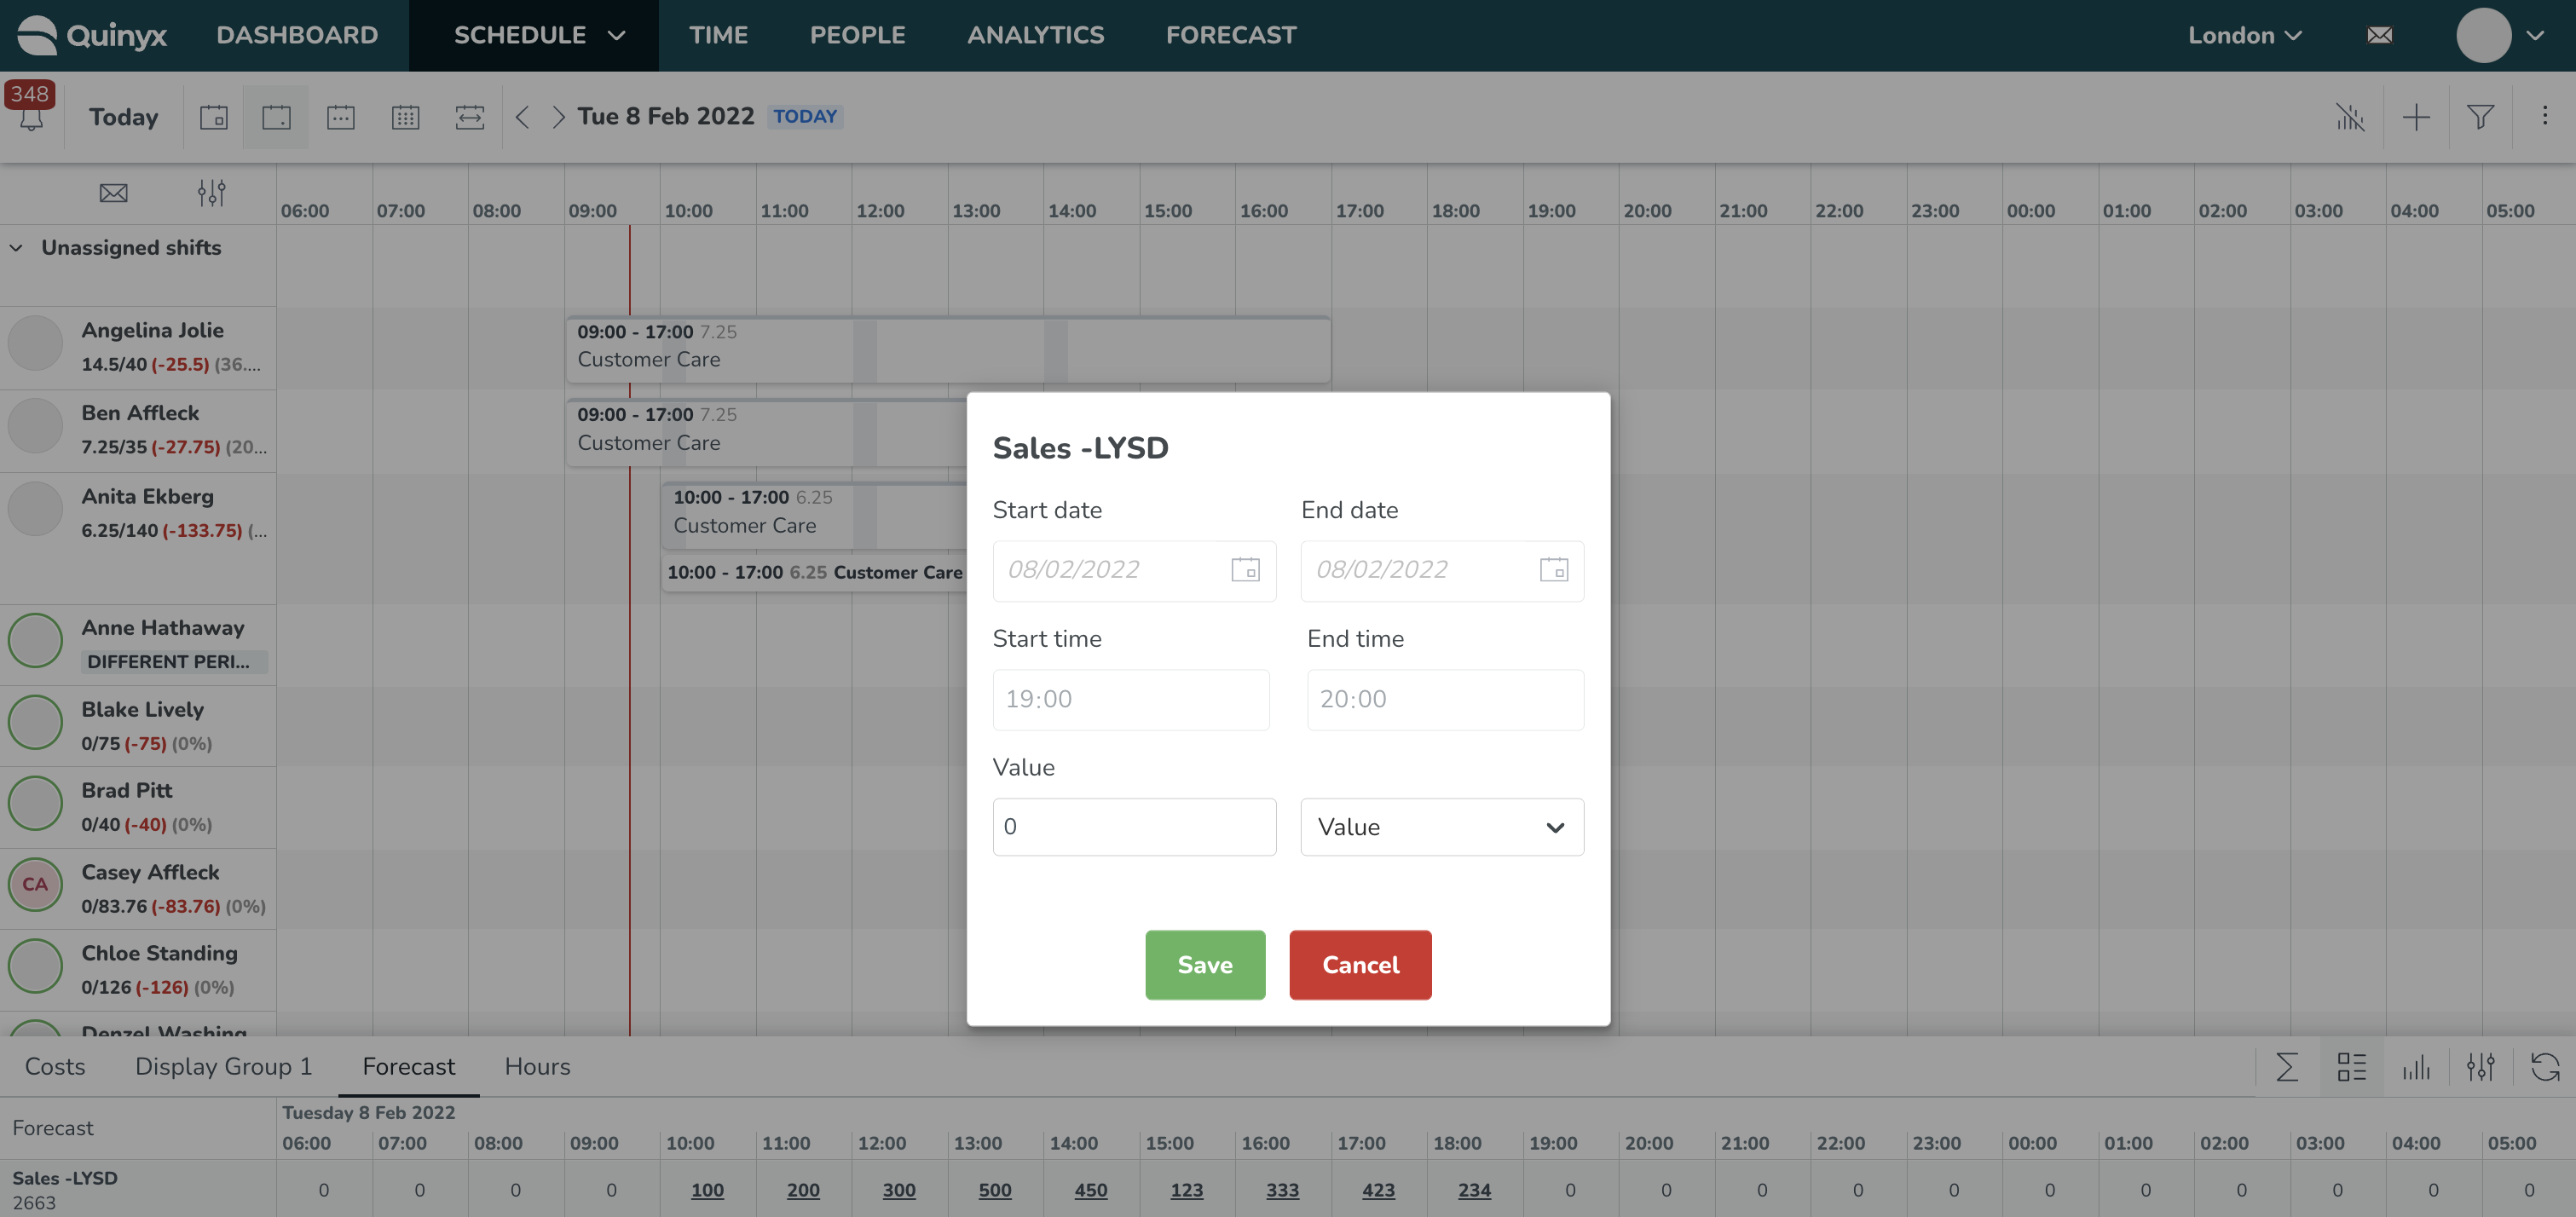
Here you can enter a new value or percentage to change the forecast. Once you click save, the newly updated forecast will display in the table as a bold number with an underline, i.e., 100.
A non edited number, meaning the original forecasted value will display in non-bold and with no underline, i.e., 100.
Once you have edited a forecast value, the edited value will also display in the graph view as a dotted line as opposed to the original forecast value which is a solid line.
Quinyx remembers statistics selections
Quinyx remembers many of your schedule selections on an account level, including statistics selections. The following items are remembered on an account level:
Item | Possible options |
Whether or not statistics are displayed | Display or don’t display |
Statistics view mode | Summary Table Chart |
Selected variables | Any variable selection in any display group (cost/hours/custom display groups) |