You need to have purchased the Forecasting module to configure and use this solution. If you're interested in this functionality, reach out to your Quinyx support contact to learn more.
Optimal Headcount calculated through the new Optimal Headcount & Labor Standard functionality can be used by the Auto Schedule algorithm to create schedules. Please reach out to Quinyx to support you in setting it up.
Please note that this new feature for calculating optimal headcount and labor standards will eventually replace the existing static and dynamic rule solutions, and labor standard calculations through Pythia (AI Optimization), once all functionalities have been integrated. However, for the time being, these methods can still be used concurrently. We'll share additional information regarding the specifics of this migration at a later date.
Introduction
Do you want to set up optimal headcount variables and labor standards in Quinyx? Well then, below are directions on how you can do this.
What are labor standards?
Labor Standard Calculation is the calculation that translates the forecasted demand of a demand driver (footfall, sales, etc.) into a required headcount curve per role based on productivity standards.
Example - The number of cashiers needed depends on the number of transactions processed. - In order to set the number of cashiers per transaction processed, the customer will need to know on average how long it takes an employee to process a transaction or how many cashiers would be required to handle a certain number of transactions.
Generally, labor standards can be configured for specific headcount variables, for specific groups (districts, units, or sections), and for specific periods of time. The time period is also important since it might be that the productivity of teams increases (for instance, if you purchase a new coffee machine you can expect your baristas to be faster in preparing coffee), and that should also be reflected in updated labor standards. Such changes in productivity are accounted for in the headcount calculation once the changes have been applied.
The outcome of the labor standard calculation is an optimal headcount curve that can be used as a basis for manual scheduling, base scheduling, and auto-scheduling in order to create a schedule that matches demand.
Prerequisites
In order to use labor standards to calculate your optimal staffing the step below is required:
Creating a forecast (manual, external, or Quinyx Demand Forecasting) on a 15, 30, or 60-minute level.
Creating the Optimal Headcount Variable
You can create your optimal headcount under Variable settings.
Once you log into your account, click on the downward arrow next to the top right-hand corner of the page, and then select Optimization settings. Once in Variable Settings, click on Add.
Currently, the variable settings open immediately upon entering Optimization settings.
Click on Add > Optimal headcount and labor standards NEW. The Optimal headcount still allows users to keep using and adding optimal headcount to be calculated through static and dynamic rules.
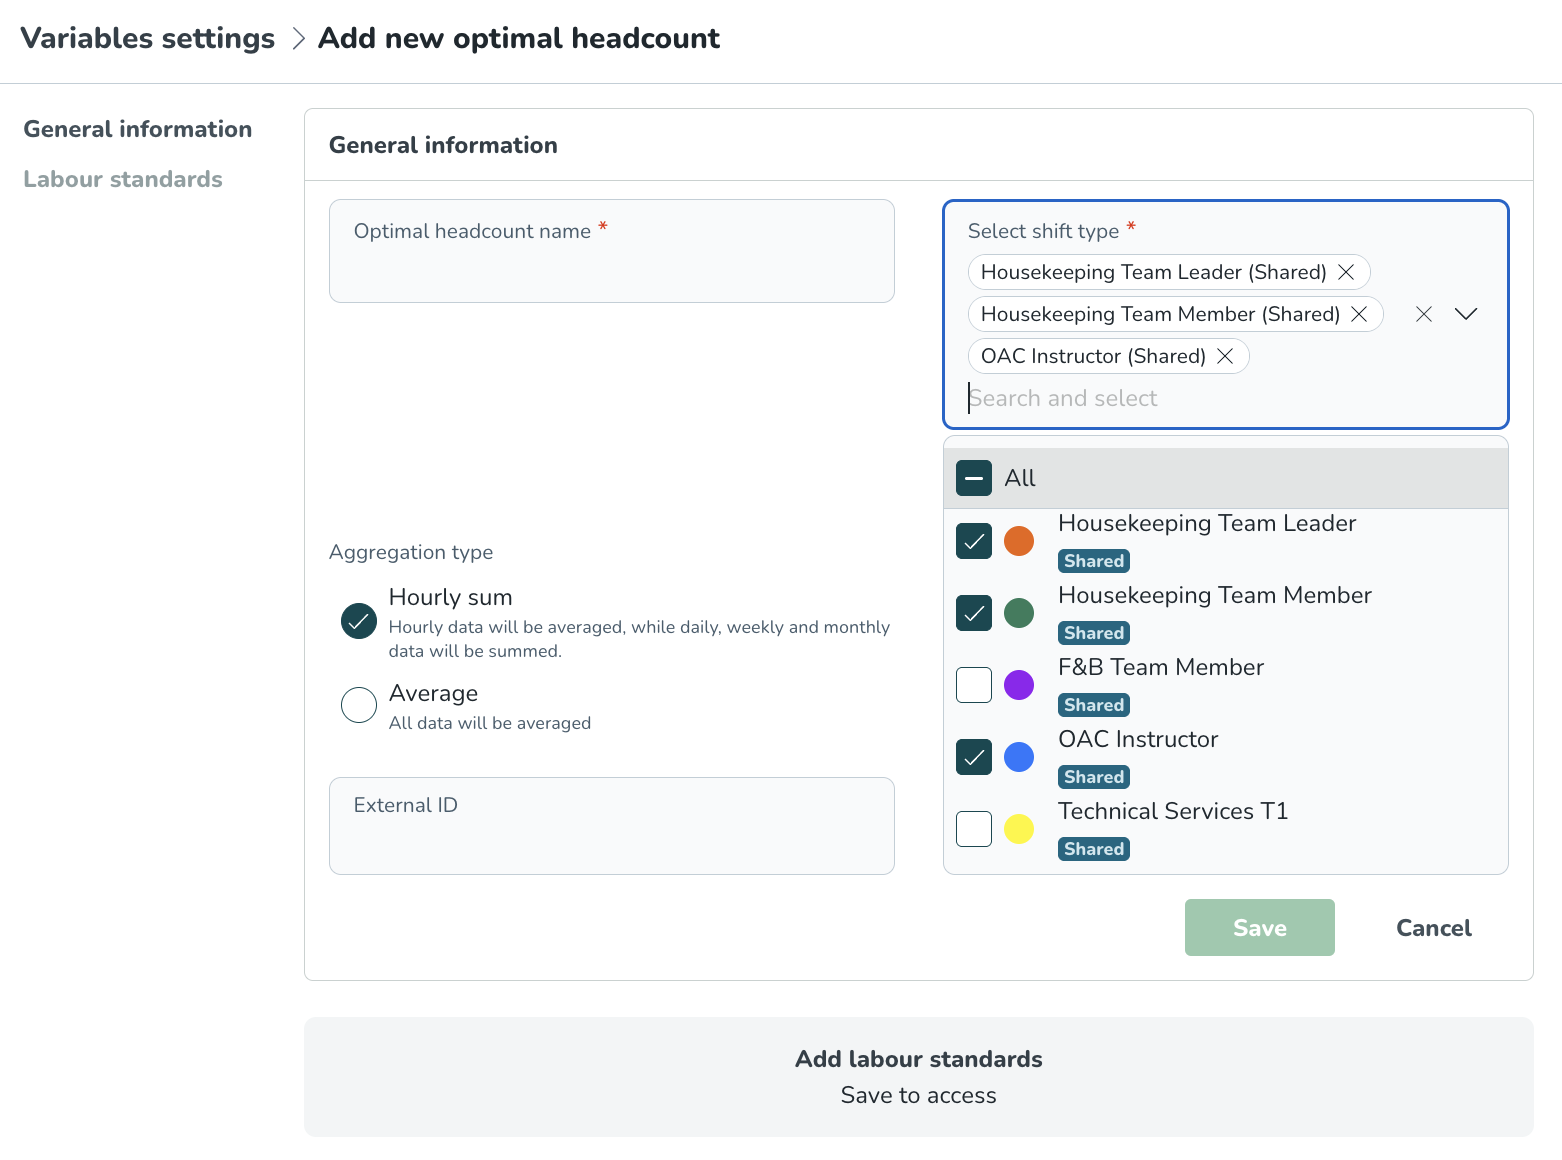
You'll then be required to fill in the relevant general information of the optimal headcount variable.
Optimal headcount name and Select shift type are mandatory fields.
Optimal headcount name*: This field is for you to enter the name you would like your optimal headcount variable to be called. For example, this could be the role of cashier or manager you're adding the headcount calculation for.
Select shift types*: This field is for you to choose the specific shift type(s) for this optimal headcount. For example, you could choose Evening Shift 17:00 – 23:00,Cashier, Cleaner, or Morning Shift 9:00 – 12:00, depending on your shift types, etc. You have to choose a shift type because in the visualization in the schedule statistics and forecast tab, you can clearly compare optimal headcount compared to scheduled headcount for that specific role/headcount.
When creating optimal headcount based on local shift types, only the units and sections related to the local shift type will be returned to the group tree when configuring labor standards. The name of the unit/section will be displayed alongside the name of the local shift type. This ensures that no units can be selected where the local shift types do not exist, and it’s clearer which specific units the local shift type belongs to.
Aggregation Type: Aggregation type determines how data is displayed in the daily, weekly, and monthly views.
Average: The average aggression method is used if you want to know how many employees you need to schedule on average within your location throughout the day.
Hourly sum: The hourly sum aggression method is used if you want to know how many hours you need to schedule within a day, which you later will spread across employees and shifts.
You can click here to read more about the Hourly sum aggression method.
Add to Display Groups: Select the relevant display group. Variables of the same display group will appear together in the forecast and schedule statistics. The headcount variable will automatically be added to the Labor display group.
Once the general details of your optimal headcount variable have been filled in, click Save.
You are not able to add your labor rules within the labor standards section.
Creating the Labor Standards
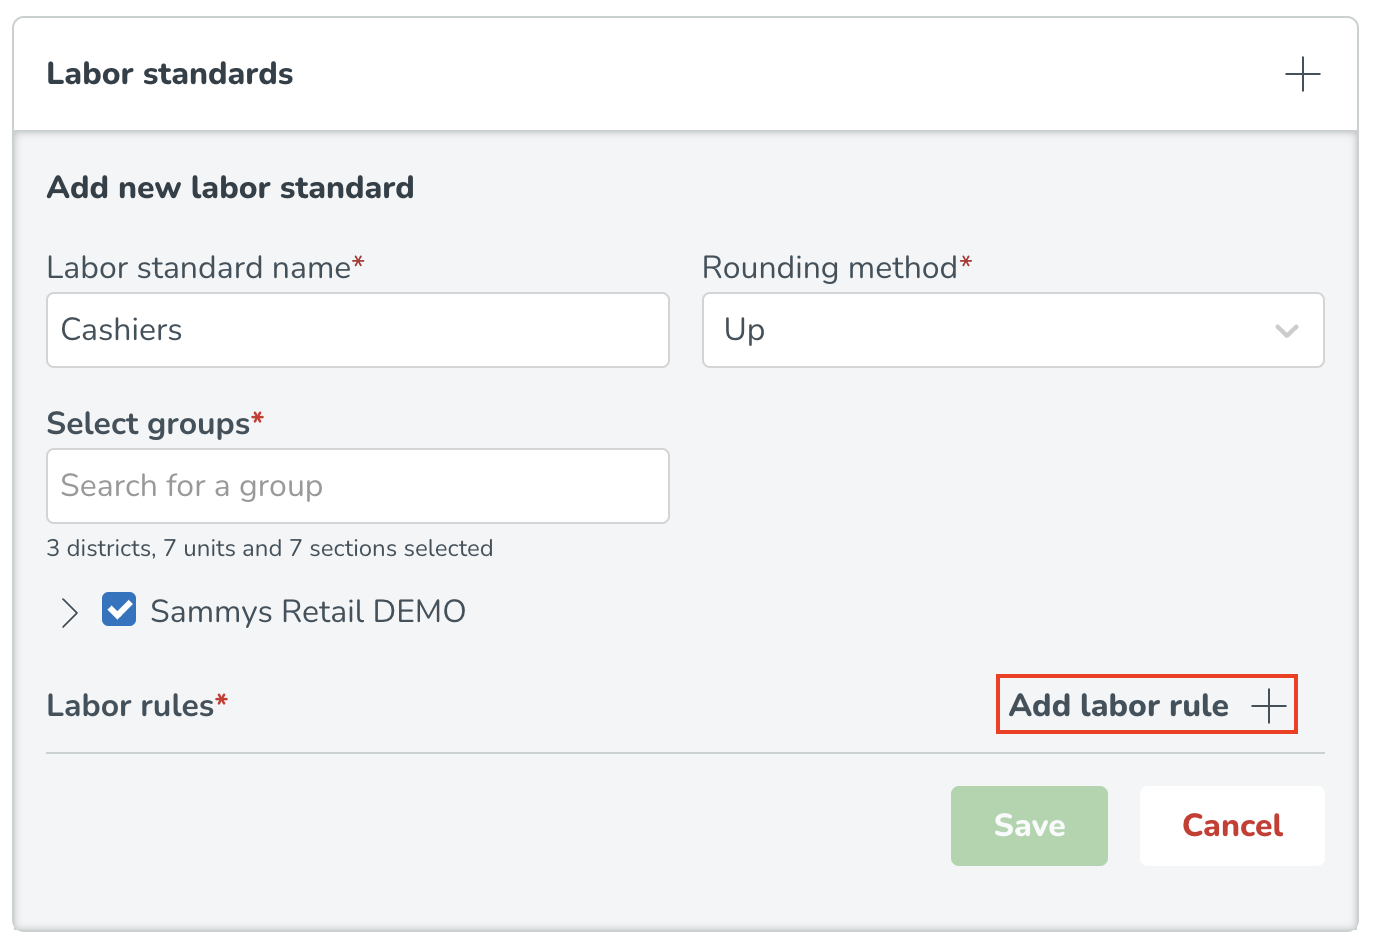
After configuring the general information about the optimal headcount variable it's time to define the specific labor standards to be used to determine optimal headcount. Different labor standards can be set up for different groups to capture differences in average productivity standards across districts, units and sections. To configure this, you'll see the following page in which you select the + button next to Labor standards.
You will then see the following page.
Then, fill in the following:
Labor Standard Name* This is the name you would like to call the labor standard. This is relevant whenever you have different labor standards for different groups (districts, units) and you want to make sure that you can differentiate between these different productivity standards.
Rounding Method* You have four options: Up, Nearest, Down, and No rounding. This indicates whether, whenever the outcome of the headcount calculation results in a decimal value, headcounts should be rounded up, down, or to the nearest integer value. Decimal values ending with .5 will always be rounded up when Nearest is selected.
The rounding rule set in the labor configuration only impacts the rounding at the lowest granular level. For example, if the needed headcount is 4.33 from 10:00-10:15 and the rounding method is up, then the optimal headcount for those 15 minutes will be 5.
There is no rounding applicable to hourly levels (unless that’s the lowest granular level). If the optimal headcount is 1 for the first part of the hour and 2 for the second part, then the optimal headcount will show 1.5. If the hourly level is the lowest granular level and the headcount needed is 4.33 with the rounding method up selected, then the optimal headcount for that hour should be 5.
There is no rounding on a daily/weekly/monthly level. These values follow the rules that are configured for the optimal headcount variable (values are either summed or averaged, not rounded up).
The rounding logic for hourly values applied to the scheduled headcount values will also be applied to the optimal headcount values.
Add select groups* This option allows you to select from your hierarchy to which groups you would like this labor standard to apply. The reason this option is mandatory is that you have the option of choosing some or all units in your hierarchy. You can select the whole organization or specific districts, units, or sections per each labor standard configuration as you may want to create more than one labor standard for different units. Whenever one group has been added to one specific labor standard configuration, you can't select that group within another labor standard configuration; it will be greyed out instead.
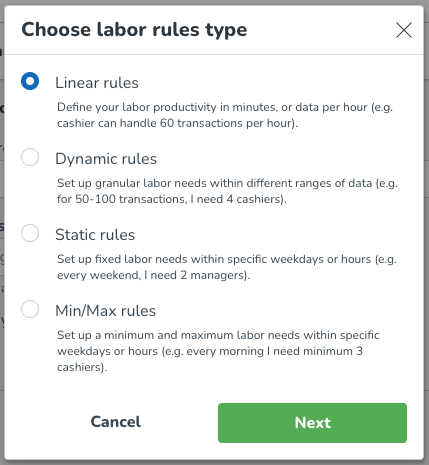
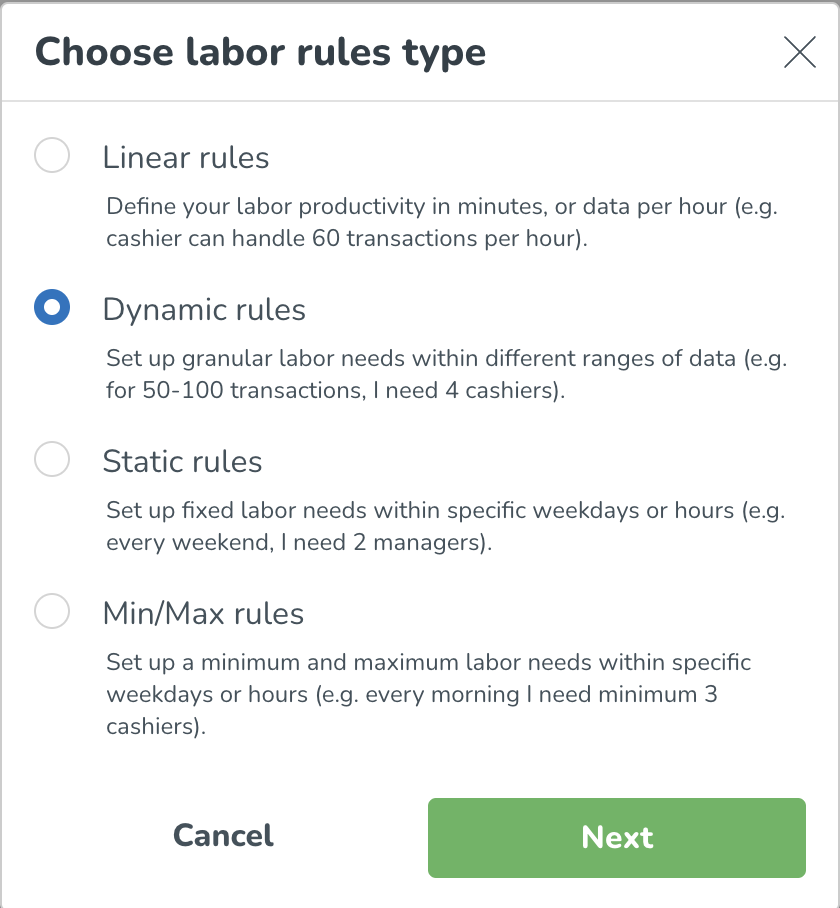
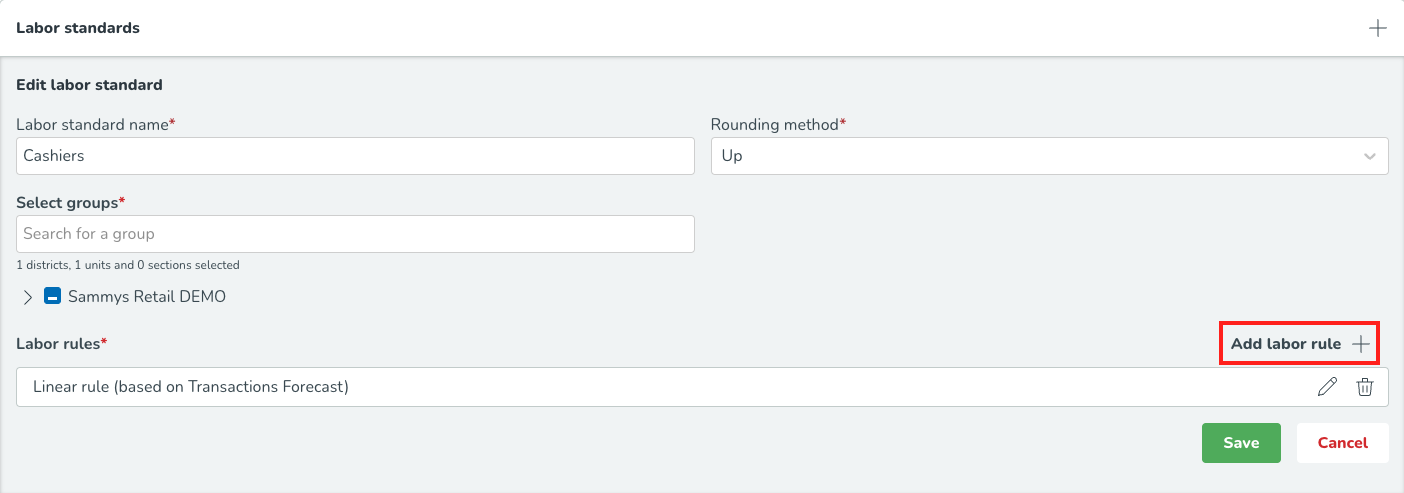
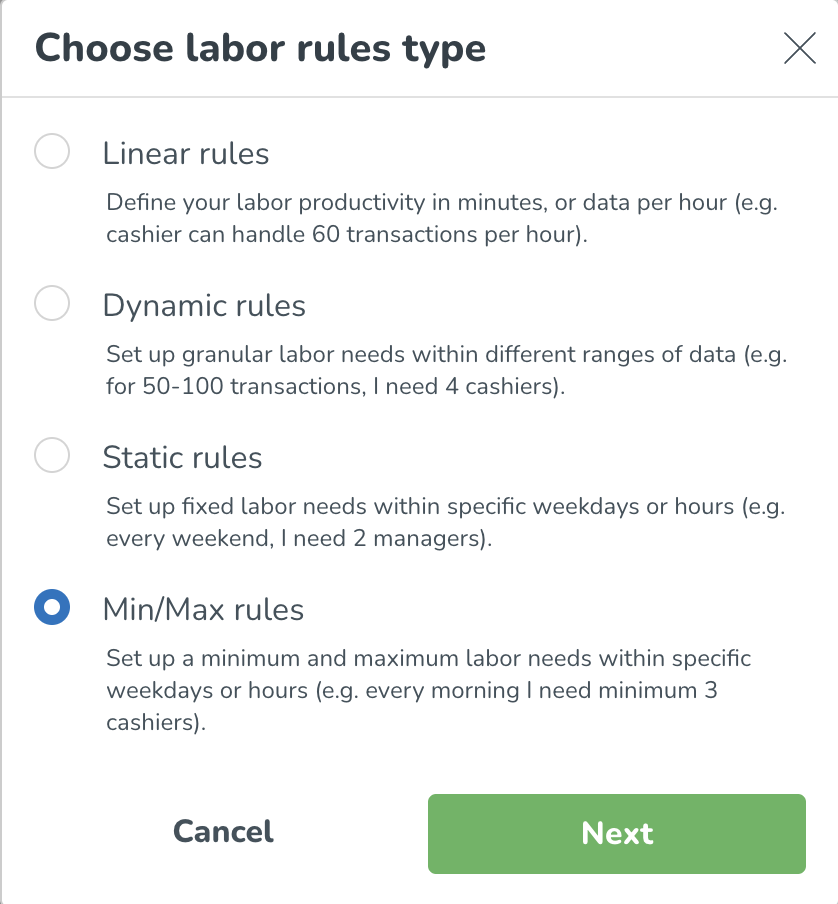
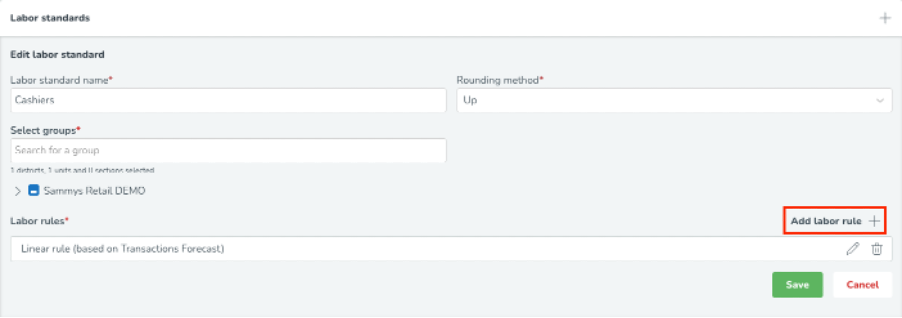
Then, add a labor rule. The labor rule includes the specific productivity calculation details you want to apply to your selected group. Click on the Add labor rule + button, you will then see the following. Select the labor rule type(s) that is applicable for you within your organization.
Creating the Labor Standards with Linear Rules
What are linear rules?
When setting up linear labor rules in your labor standards for your specific optimal headcount variable, you have two format options you can select from:
Data Per Hour: For example, if it takes a cashier 2 minutes per transaction and we predict 60 transactions between 10 am-11 am, we would need 2 cashiers between 10 am-11 am.
Minutes Per Data: For example, if it takes a chef 5 minutes to prepare a burger, and we predict 24 burger orders between 10 am and 11 am, we would need 2 chefs between 10 am and 11 am. But because we also predict that customers will order 30 French fries, and it takes a chef 2 minutes to prepare French fries, we need 3 chefs in total between 10 am and 11 am.
How do you configure linear rules?
No single format is consistently used for defining productivity levels across industries when using the linear method. Some industries prefer to use Minutes per data while others prefer to use Data per hour.
Here, you will have the flexibility to choose the format you are familiar with in order to ensure that the configuration is as easy as possible to maintain.
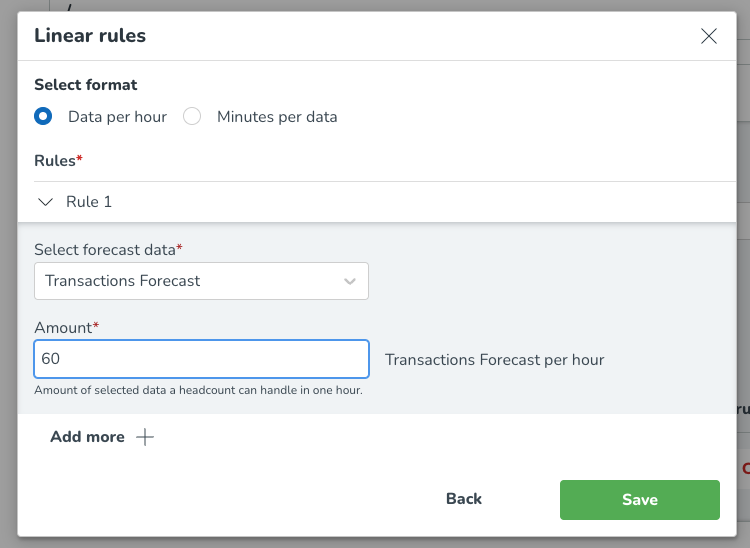
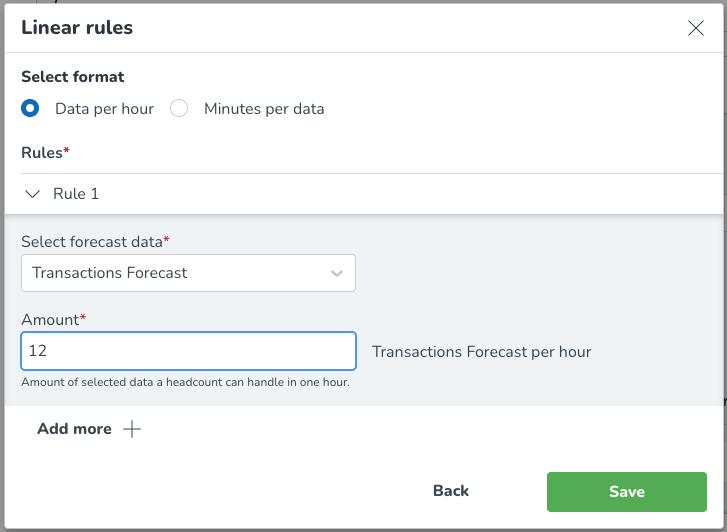
For Data per hour, as seen in the below image, select the format (data per hour), which will enable you to select the forecast data that the headcount requirement is based on and enter the required amount. You can select Add more to add additional labor rules based on other forecast data variables.
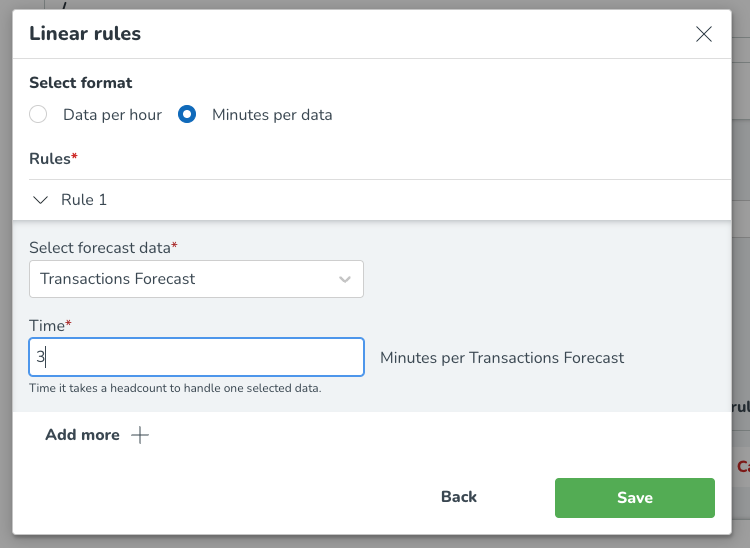
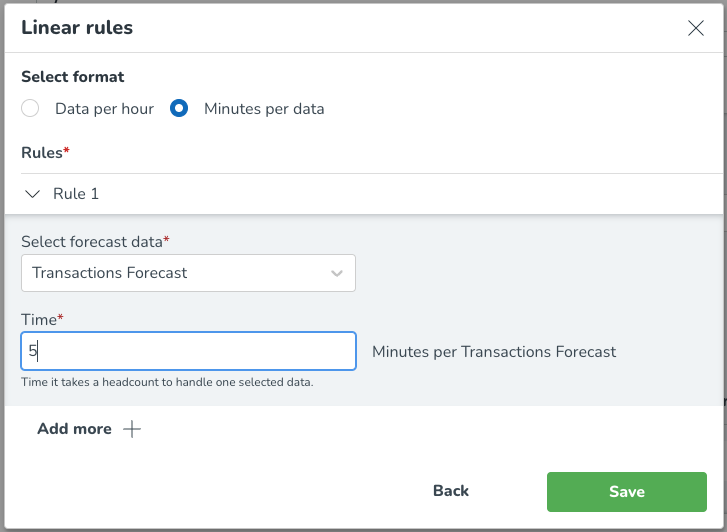
For Minutes per data, as seen in the image below, select the format (minutes per data), which will enable you to select the forecast data that the headcount requirement is based on and enter the required minutes per selected forecast variable. You can select Add more to add additional labor rules based on other forecast data variables.
When the format required has been selected and the required information has been entered, click the Save button.
You can see the filled-in versions of both formats of the labor rule below.
Data per hour
In this example, we have selected that the number of cashiers depends on the number of transactions, where one cashier is able to handle 12 transactions in a single hour. This means that when the forecast of transactions predicts 24 transactions within a specific hour, we would need 2 cashiers to cover that demand.
Minutes per data
In this example, we've selected that the number of cashiers depends on the number of transactions, where one cashier requires 5 minutes to handle a transaction. This means that when the forecast of transactions predicts 24 transactions within a specific hour, we would need 2 cashiers to cover that demand.
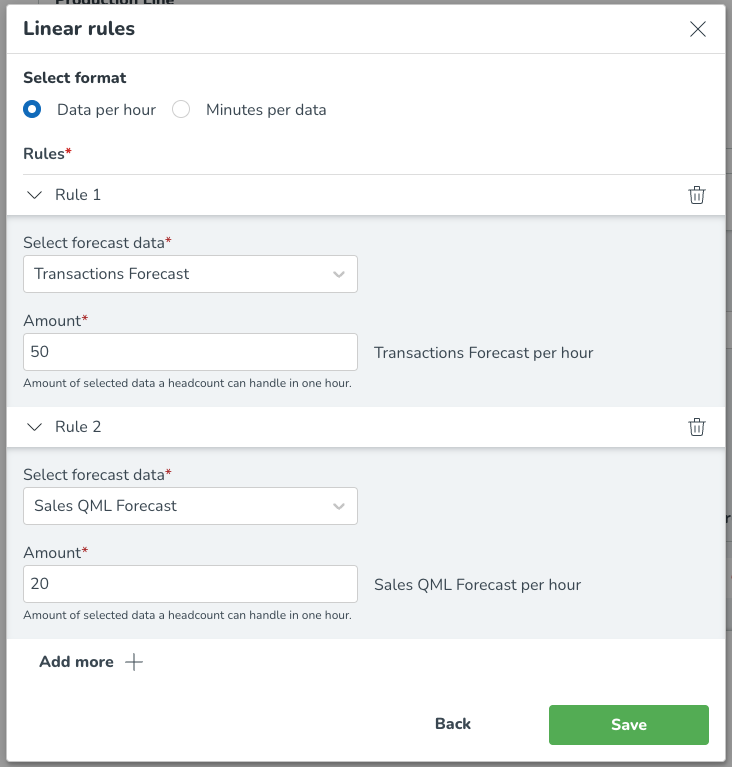
You can also add multiple configurations to a selected format. You can do this by selecting Add more multiple times after having entered your initial forecast data and productivity level. Below, you can see how this will look on the platform.
Once you've added more than one configuration, you will be able to see these configurations in a list view as seen in the below image.
Here, you can see your labor rules saved.
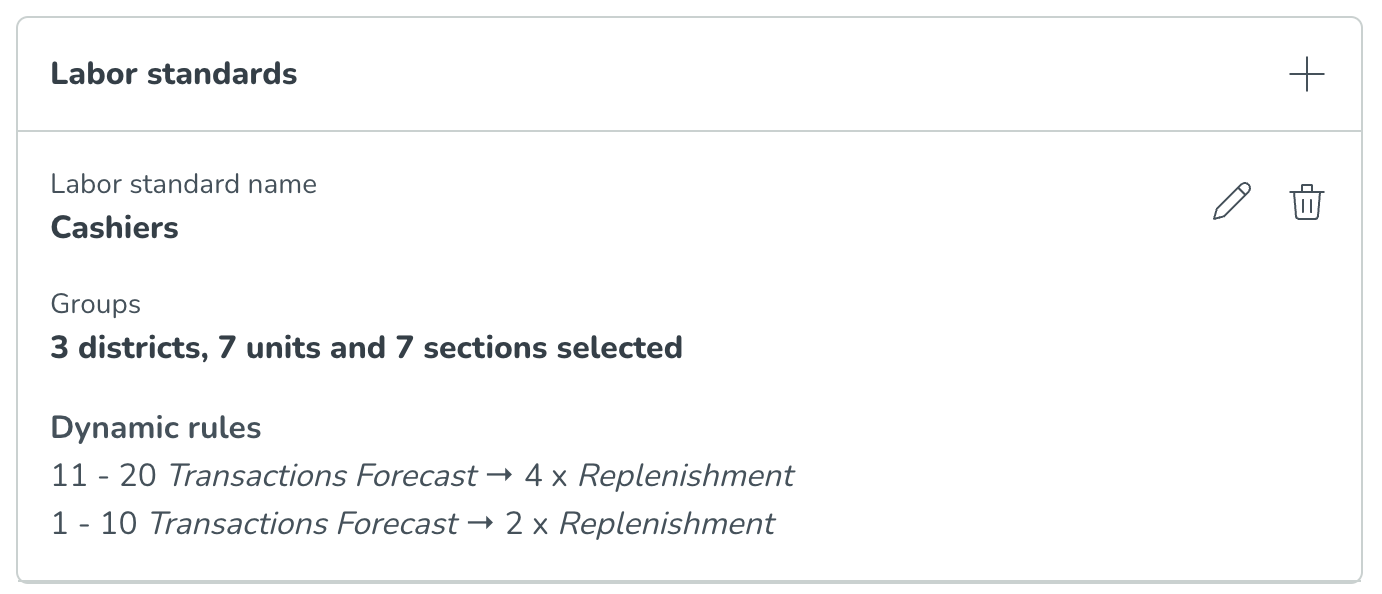
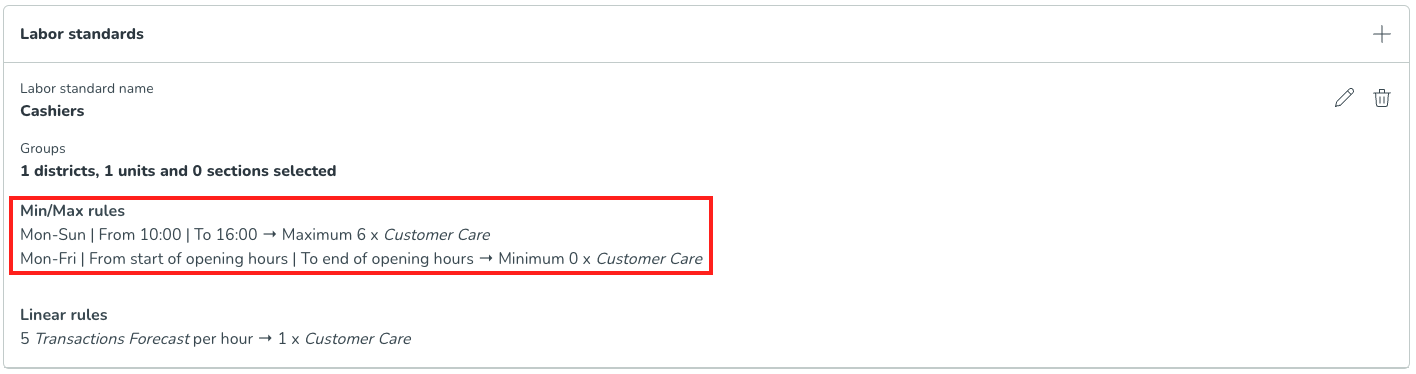
Below is what you will see once all relevant fields have been completed, and the labor standards have been saved. The summary section of the labor standards allows for an easier overview of the configured labor rules and an indication of how many districts, units, and sections it is applied for.
You can also add more than one labor standard, as seen in the image below. This is relevant whenever different groups have different levels of productivity and therefore need to be configured separately.
If you have multiple labor standards, you will be able to see the summary as follows.
Creating the Labor Standards with Dynamic Rules
Dynamic rules in labor standards will, over time, replace the Dynamic rules that can be configured in group settings currently. Please keep track of the Quinyx release notes to get more information when this becomes relevant. If you want to configure your labor needs for the first time, please make sure to use these Dynamic rules and not the ones in Group Settings.
What are dynamic rules?
Dynamic rules are a second way, next to linear rules, of defining labor needs based on forecasted sales/transactions/items sold/etc. They can be configured for your Optimal Headcount individually or combined with other labor rules. In contrast to linear rules, dynamic rules allow you to create a non-linear relationship between your forecast levels and your headcount needs. As such, you are able to handle scenarios where, for example, during busy periods cashiers are able to handle a transaction faster than during slower periods.
Dynamic rules are based on specified forecast ranges/buckets, which results in predefined headcount needs. For example, if I have between 1-40 transactions within an hour, I would need 2 cashiers scheduled. Compared to linear rules, dynamic rules don't require averaged productivity metrics such as the average time it takes for a cashier to handle a transaction.
How do you configure dynamic rules?
To configure minimum and maximum rules, you first need to follow the steps mentioned earlier in this article around creating your optimal headcount variable, as well as entering the initial labor standard rules. You can add your dynamic rules to the same labor standard as your other rules (e.g. minimum and maximum rules) or you can create another labor standard if these new dynamic rules are applicable to a different group.
Once your labor standards are created, you can add your specific dynamic rules.
Select Add labor rule
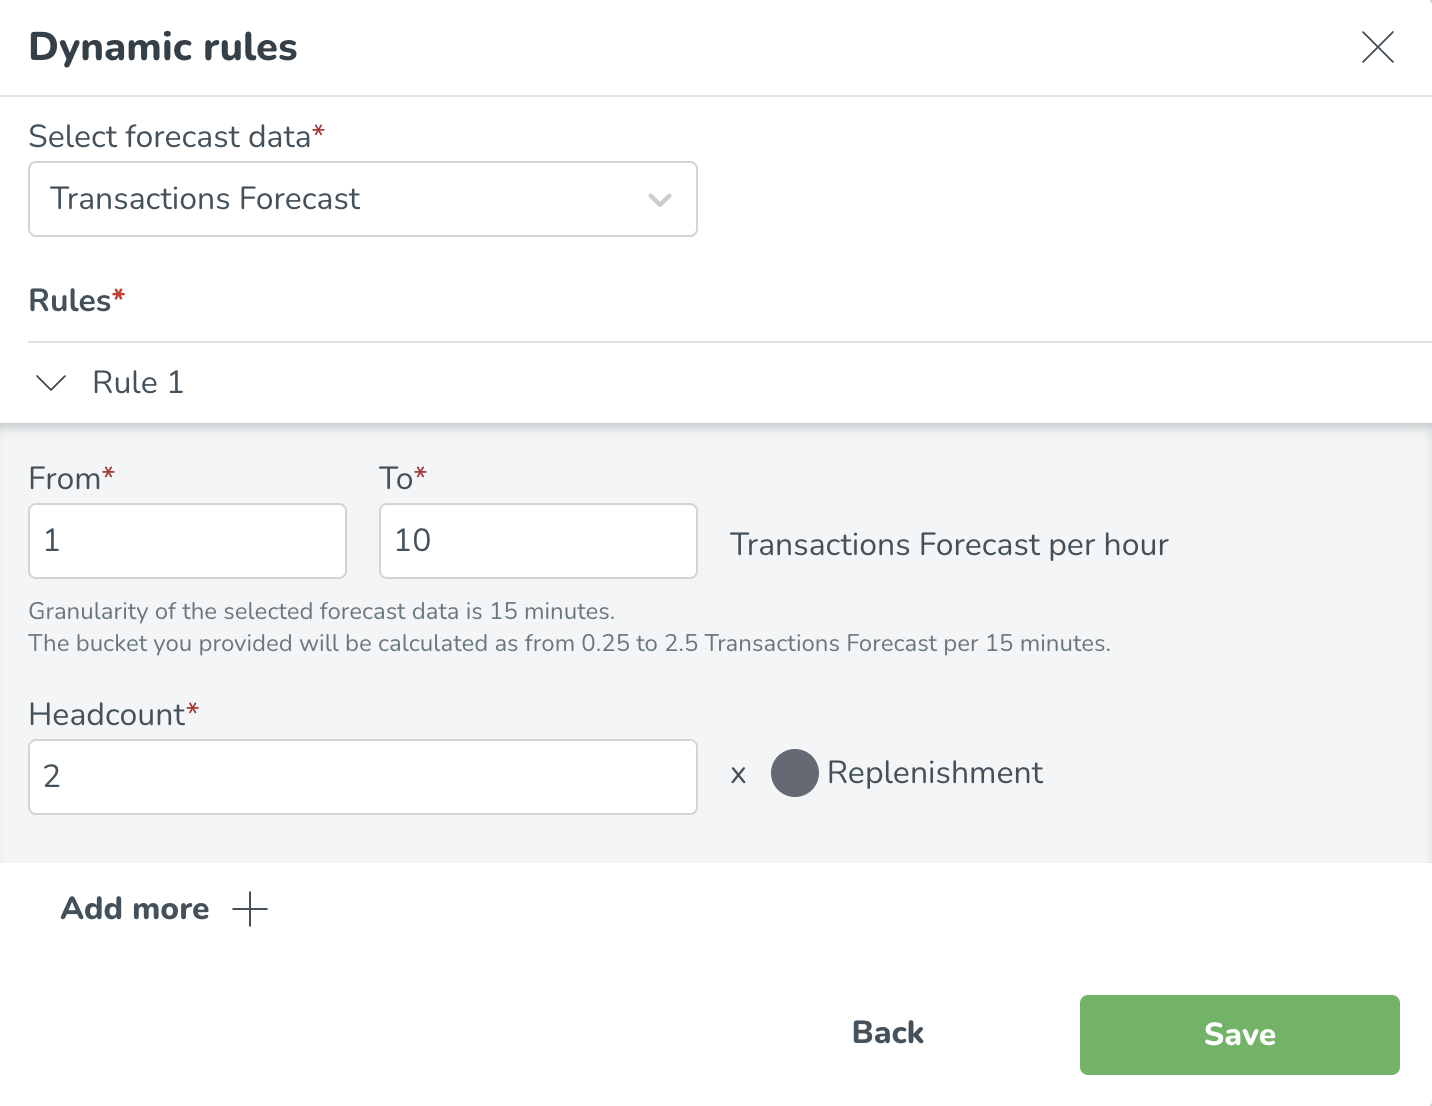
Select Dynamic rules
Select the forecast data that the dynamic rule is based on
Enter the specific dynamic labor rules applicable to your organizationAdd multiple forecast ranges/buckets by selecting add more.
When satisfied with the buckets added, select save. Once all rules are saved, you are able to see the specific dynamic rules in the labor standards summary.
Constraints and considerations when adding Dynamic rules
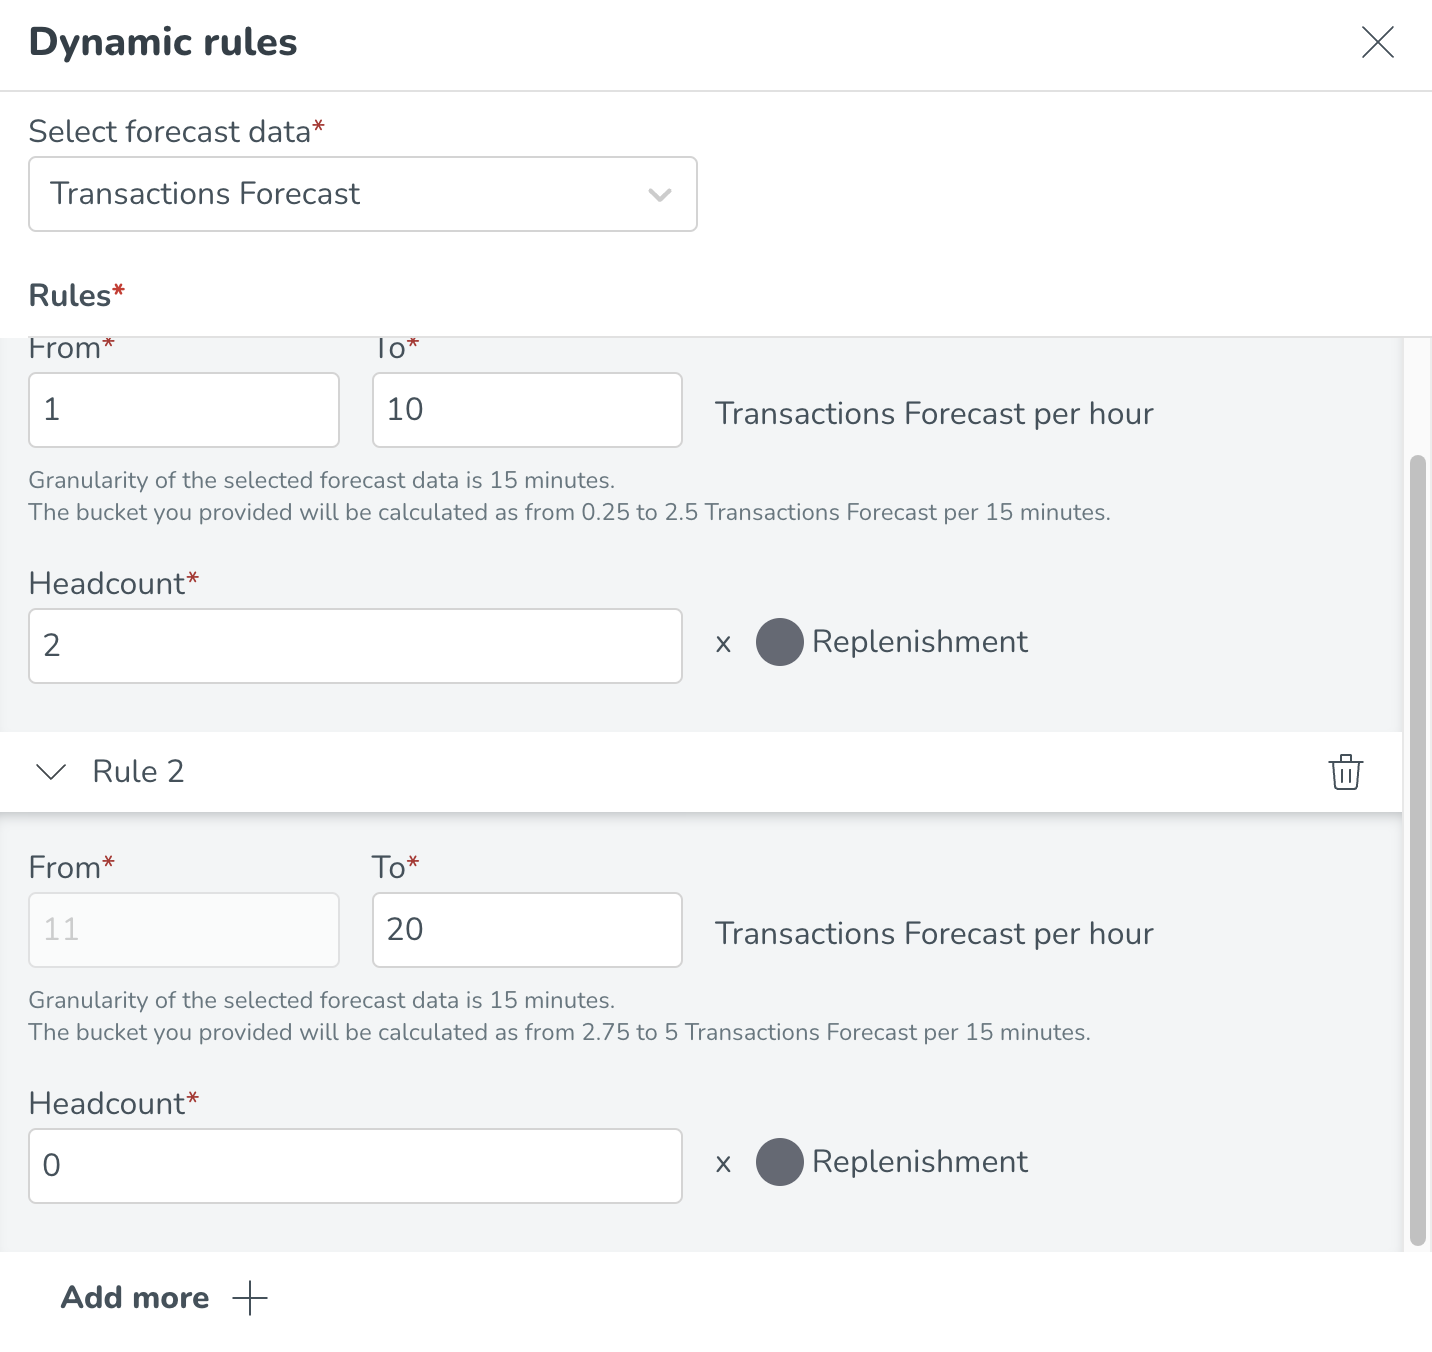
You cannot add overlapping buckets
The from of the subsequent bucket will always have the next value following the to of the previous bucket (e.g. 1-10 transactions, 11-20 transactions)
The to of the bucket always needs to be larger than the from
Any forecast values larger than the higher value in the last bucket will result in a zero headcount value, so make sure to add large enough buckets to cover all possible forecast values
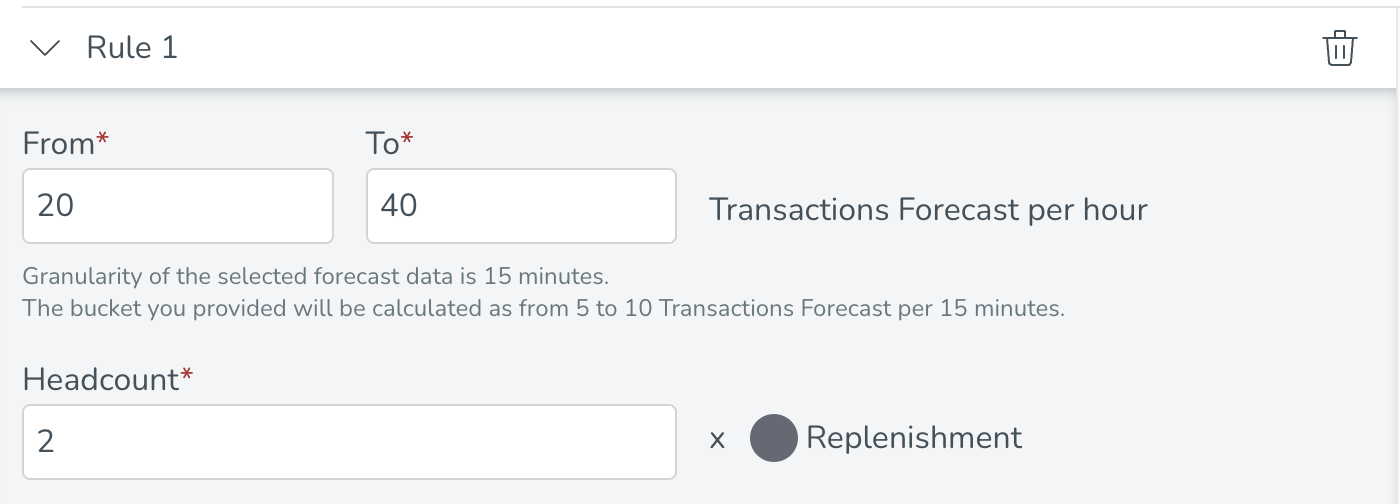
Data granularity: the dynamic rules are only configurable on an hourly basis (e.g. from 20 to 40 transactions per hour require 4 headcount). The ranges will automatically be recalculated based on the granularity of your selected forecast data. For example, if your forecast data has a 15min granularity we will calculate the bucket as from 50 to 10 transactions per 15 minutes require 4 headcount. As such we are able to correctly relate your dynamic rule configuration to your underlying data granularity. This is also explained in the description text below each bucket (see screenshot below).
Creating the Labor Standards with Minimum/Maximum Rules
What are minimum and maximum rules?
Minimum and maximum rules are constraints that can be configured for your Optimal Headcount to indicate the minimum or maximum headcount needed for that specific role/shift type. For example, it might be that you need to ensure that at least 1 manager is scheduled at all times. Alternatively, make sure that you can never schedule more than 6 cashiers at the same time, although demand might require it because of the physical constraints of the unit.
Minimum and maximum rules can be used for informative purposes when doing manual scheduling, or to constrain the Auto Schedule to ensure that the resulting schedule does not exceed the set minimum or maximum requirements.
In future releases, we also plan to visualize minimum and maximum rules in the labor display group. Please stay tuned in release notes!
How do you configure minimum and maximum rules?
To configure minimum and maximum rules, you first need to follow the steps mentioned earlier in this article around creating your optimal headcount variable, as well as entering the initial labor standard rules. You can add your minimum and maximum rules to the same labor standard as your other rules (e.g. linear rules) or you can create another labor standard if these new minimum and maximum rules are applicable to a different group.
Once your labor standards are created, you can add your specific minimum and maximum rules.
Select Add labor rule
Select Min/max rule
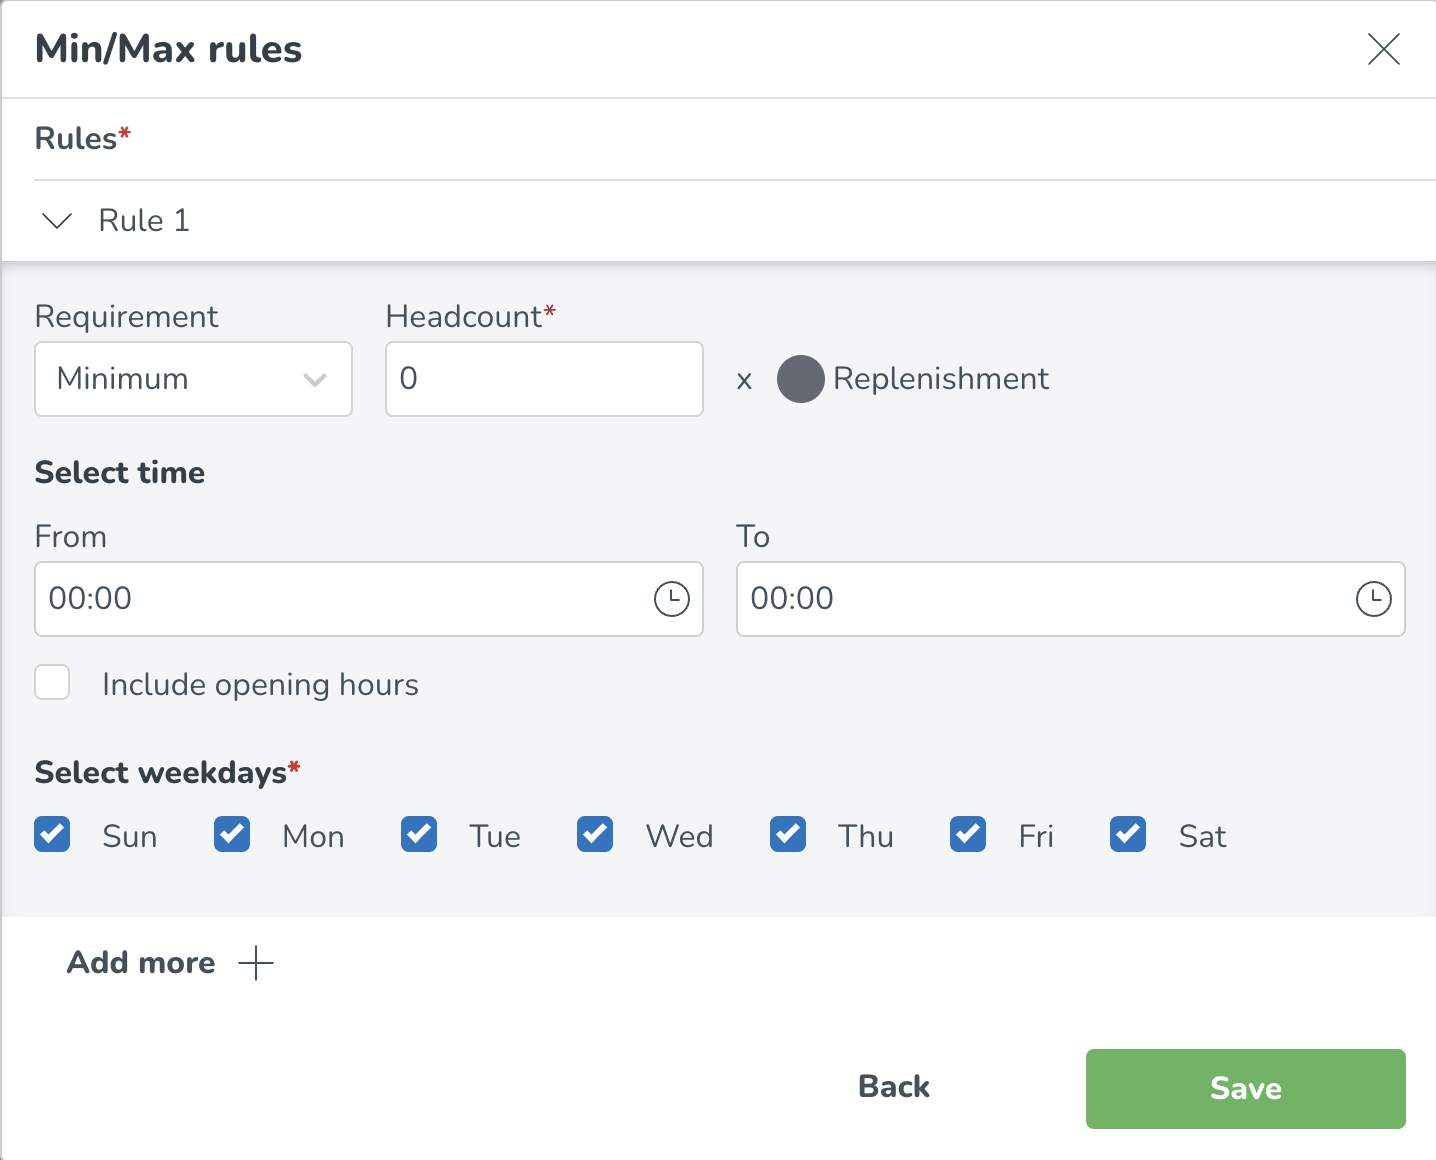
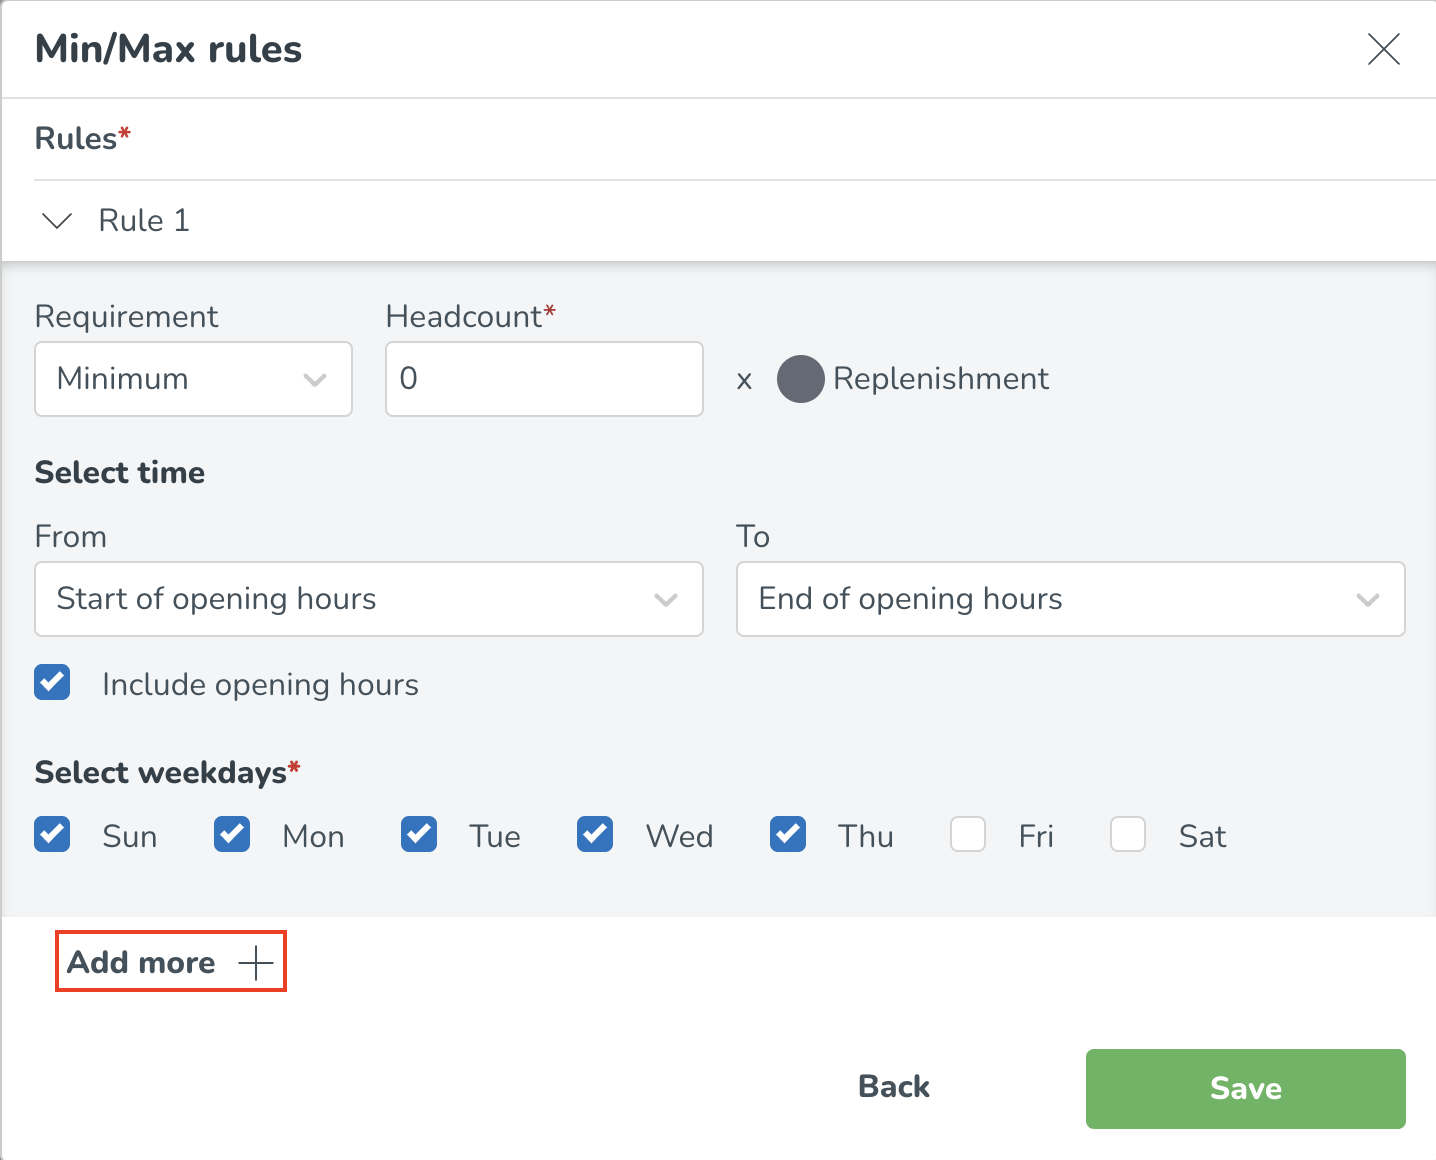
Select whether you are adding a minimum or a maximum rule in the dropdown, and enter the specific minimum or maximum headcount requirement applicable for the specific role/shift type.
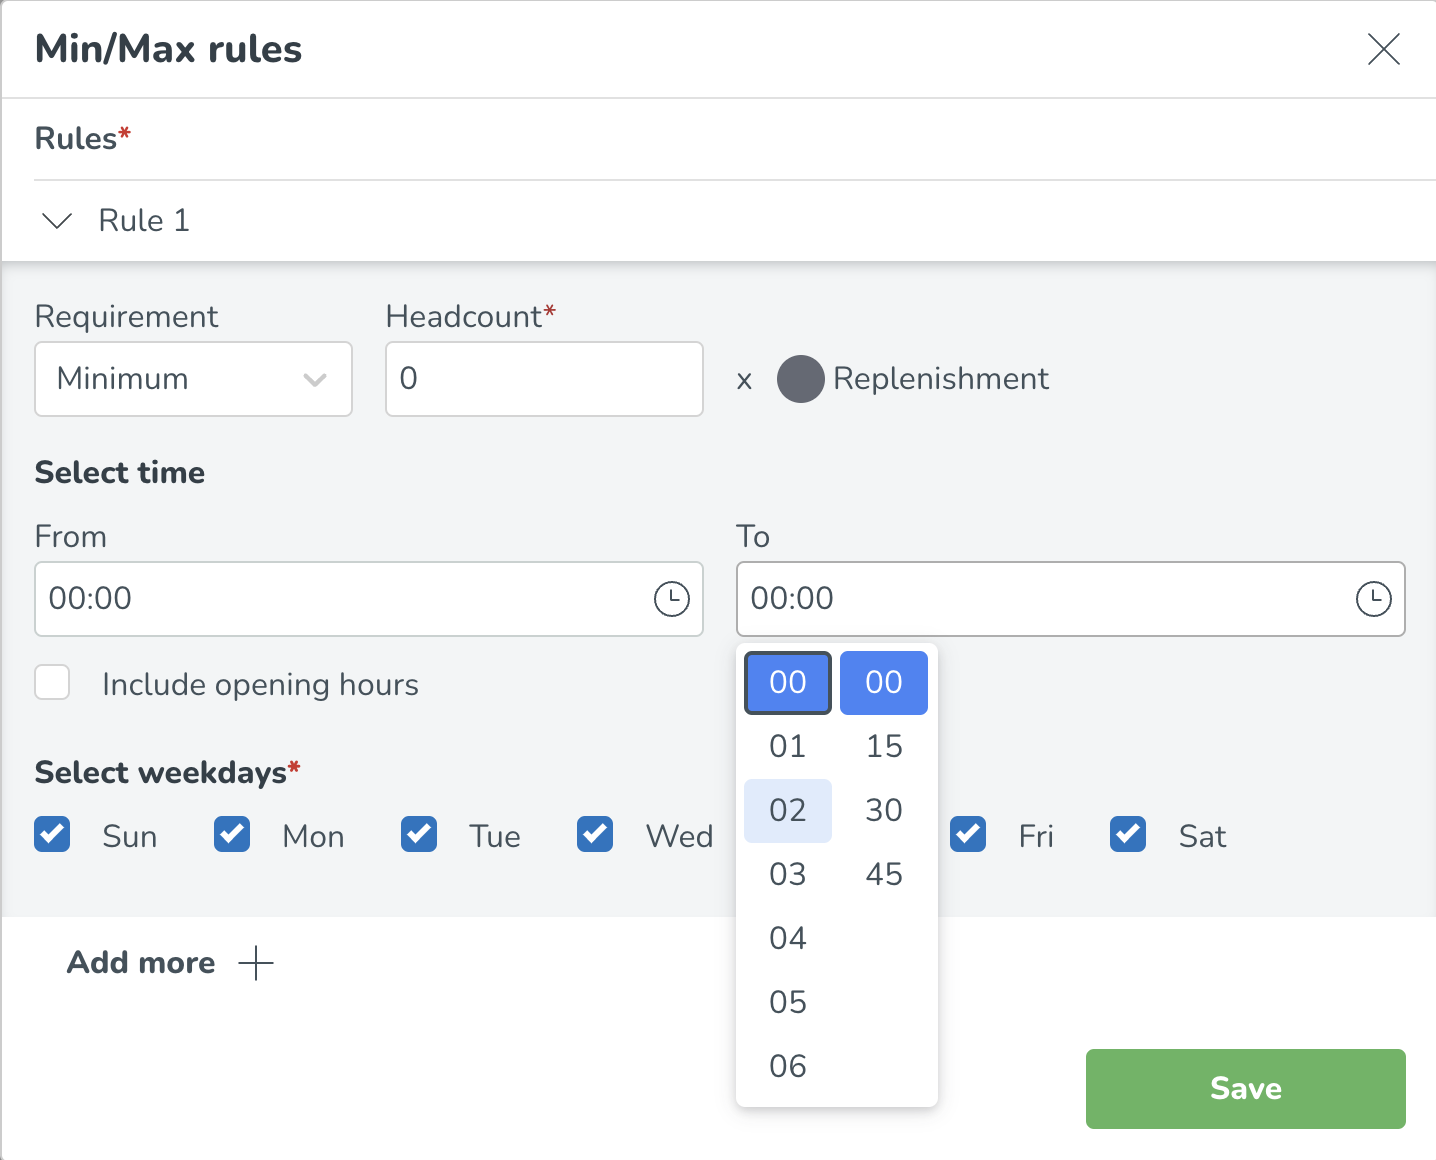
Minimum and maximum rules can be configured per time of day. This can be done by entering or selecting the specific time frames on a 15 min level.
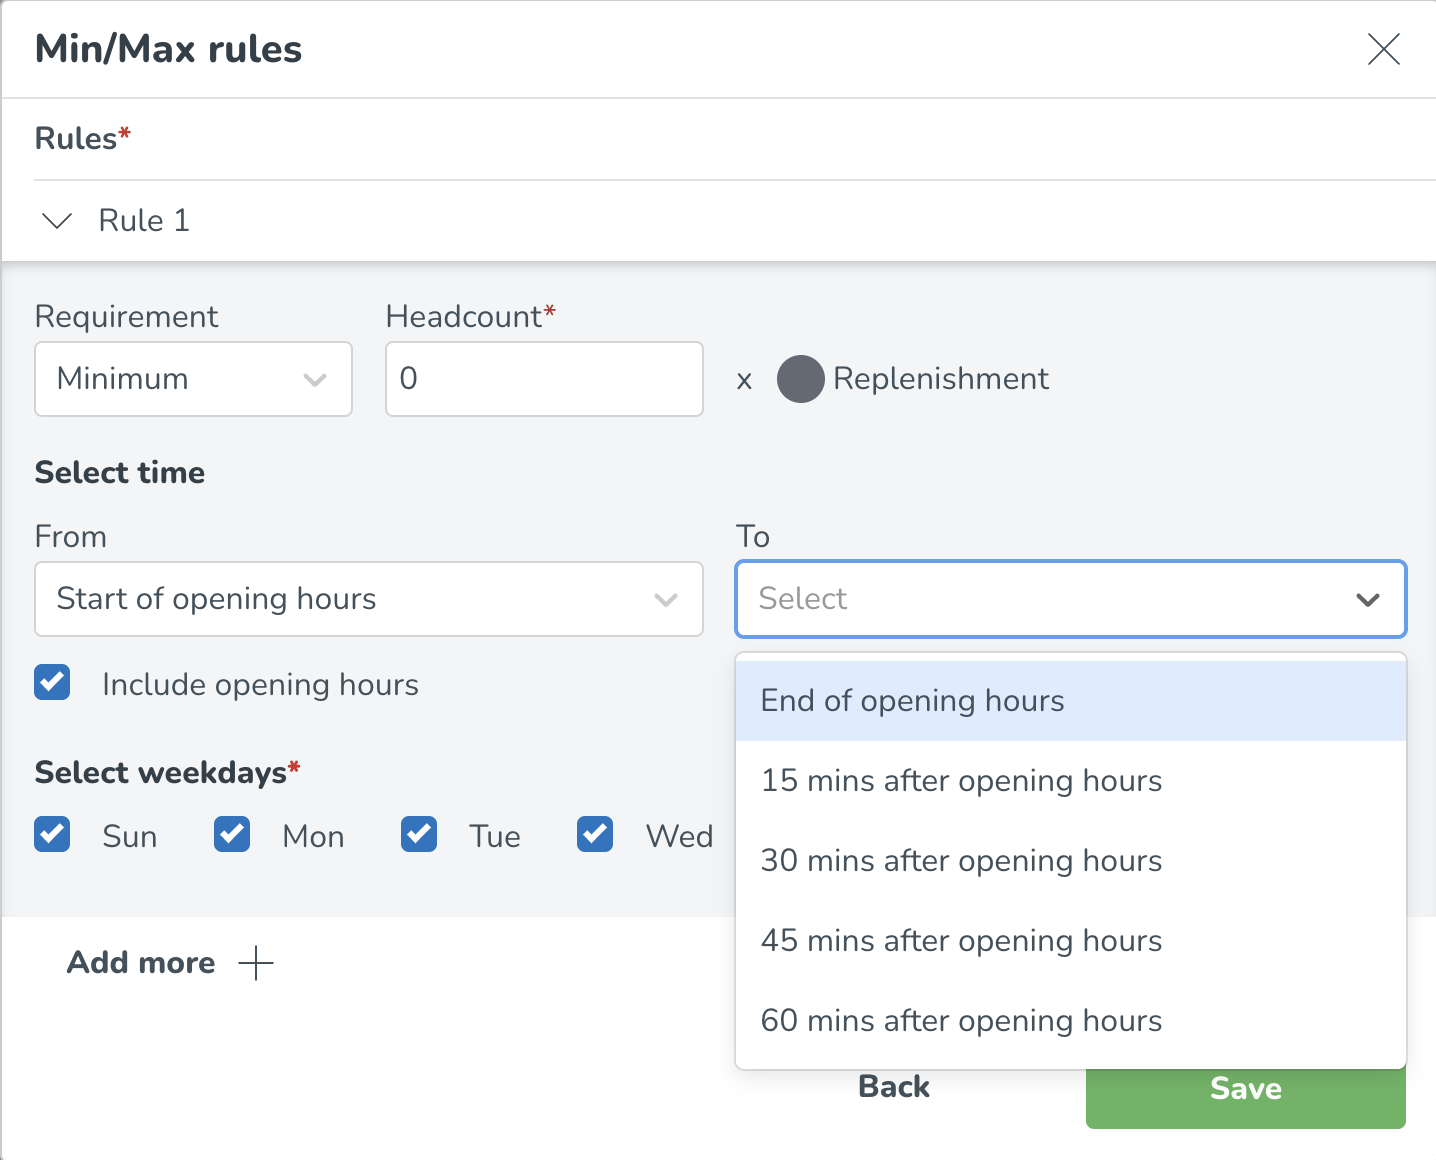
It is also possible to connect the minimum and maximum rules to your opening hours, e.g. you need a minimum of 1 manager 15 minutes before opening hours to 15 minutes after opening hours. Read more about how to set up your opening hours here: Opening hours - standard and special hours.
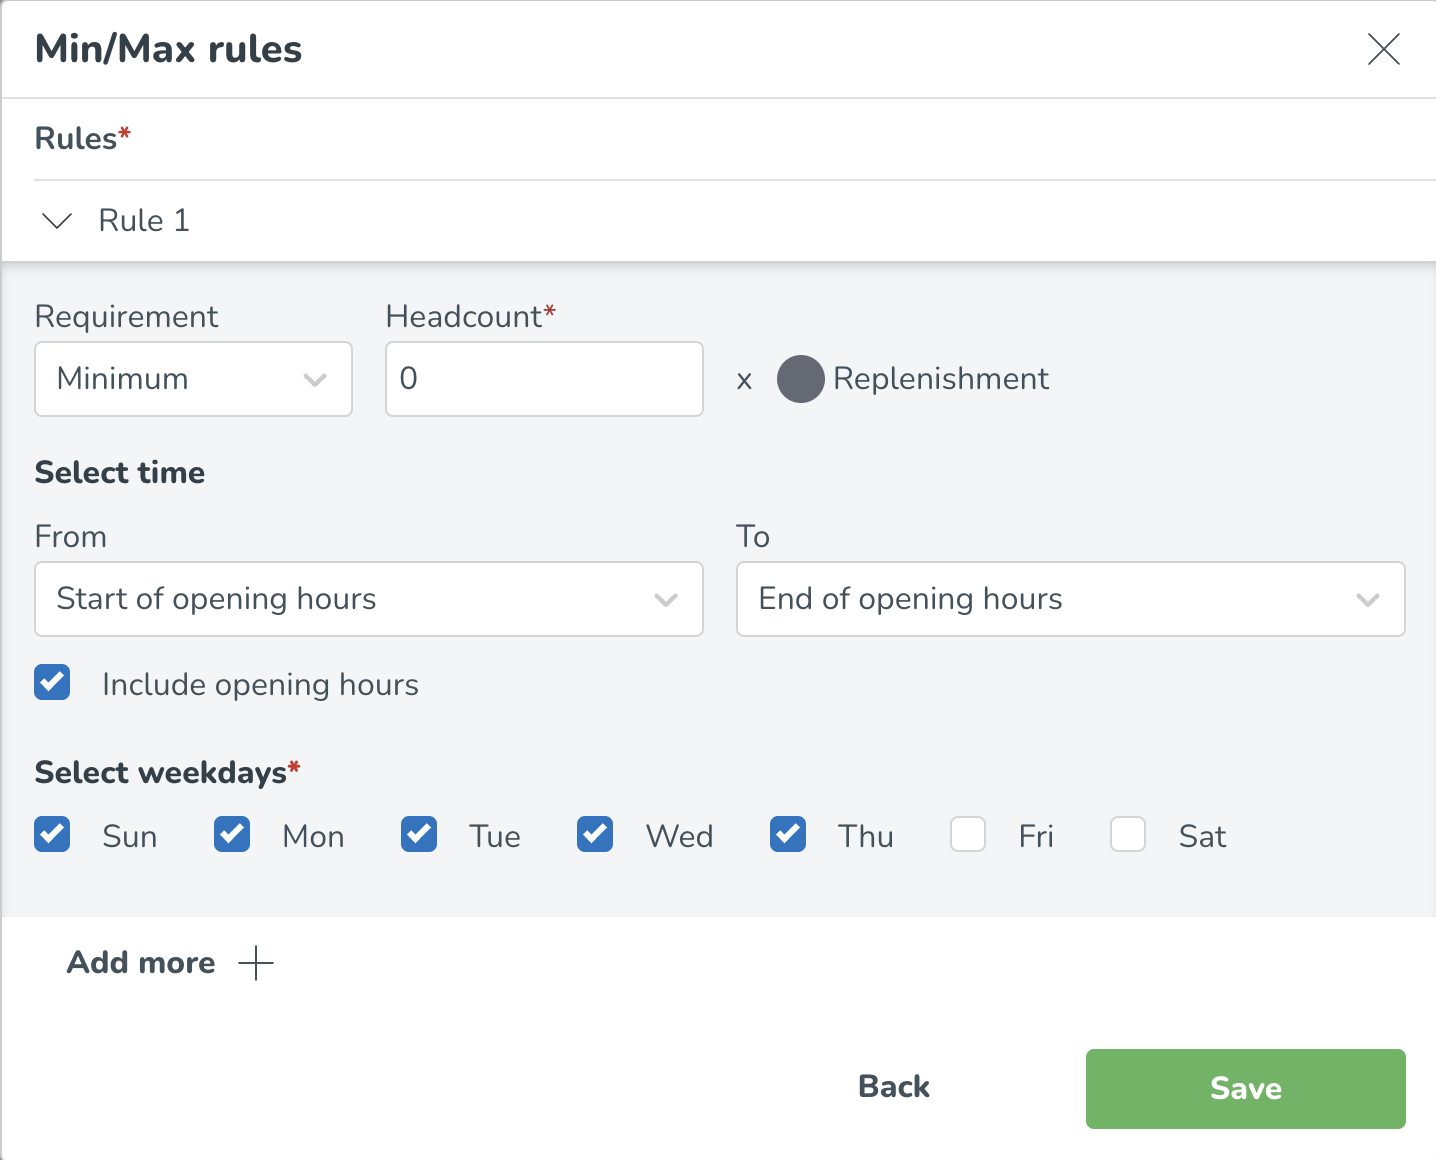
Min/max rules based on opening hours can be configured by selecting the Include opening hours option and entering the relative requirements to opening hours.
Minimum and maximum rules can also be configured per day of the week. By selecting/unselecting specific weekdays within the Select weekdays* section, you are able to choose which days these specific rules are applicable.
Add additional rules by selecting Add more, and add any additional minimum or maximum rules based on the time of day and day of week.
Once all rules are saved, you are able to see the specific minimum and maximum rules in the labor standards summary.
Constraints on minimum and maximum rules
You cannot add conflicting minimum and maximum rules.
If you add multiple minimum or maximum rules for the same time period and same day, Quinyx will use the most strict rule (i.e. the highest minimum requirement and the lowest maximum requirement).
Creating the Labor Standards with Static Rules
What are Static Rules?
Static rules are another way of defining labor needs. Static rules are a constraint that can be configured for your Optimal Headcount to indicate the headcount needed as it is a fixed and repeating requirement. For example, you may always need one manager scheduled at all times during your opening hours.
How do you configure Static Rules?
To configure Static Rules, you first need to follow the steps mentioned earlier in this article around creating your optimal headcount variable and entering the initial labor standard rules. You can add your Static Rules to the same labor standard as your other rules (e.g., linear rules) or create another labor standard if these static rules apply to a different group.
Once your labor standards are created, you can add your specific static rules.
Select Add labor rule.
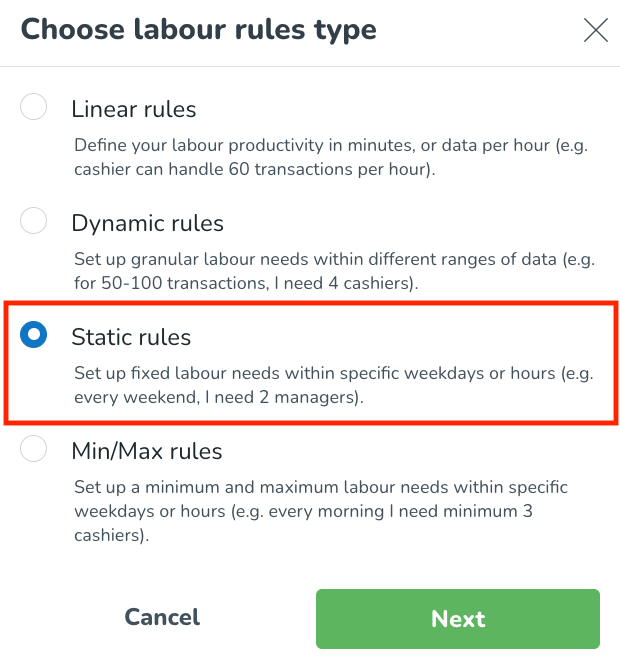
Select Static Rules.
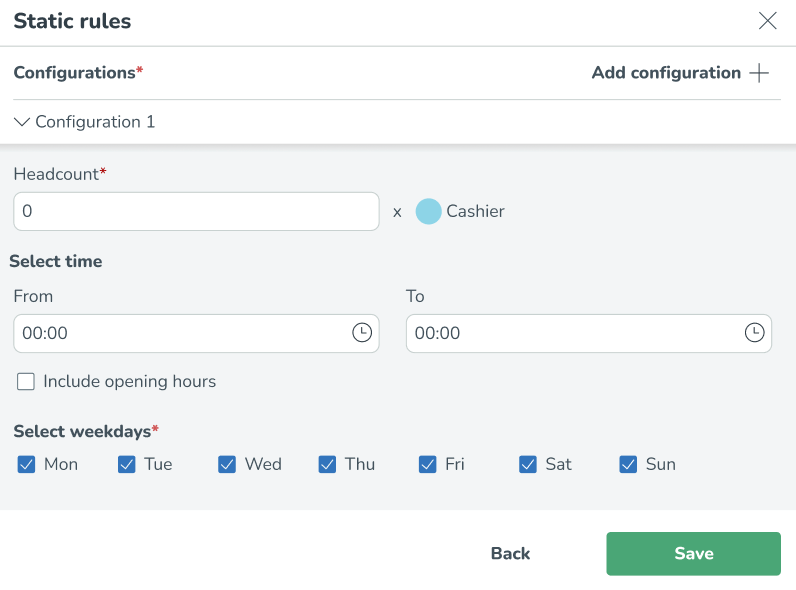
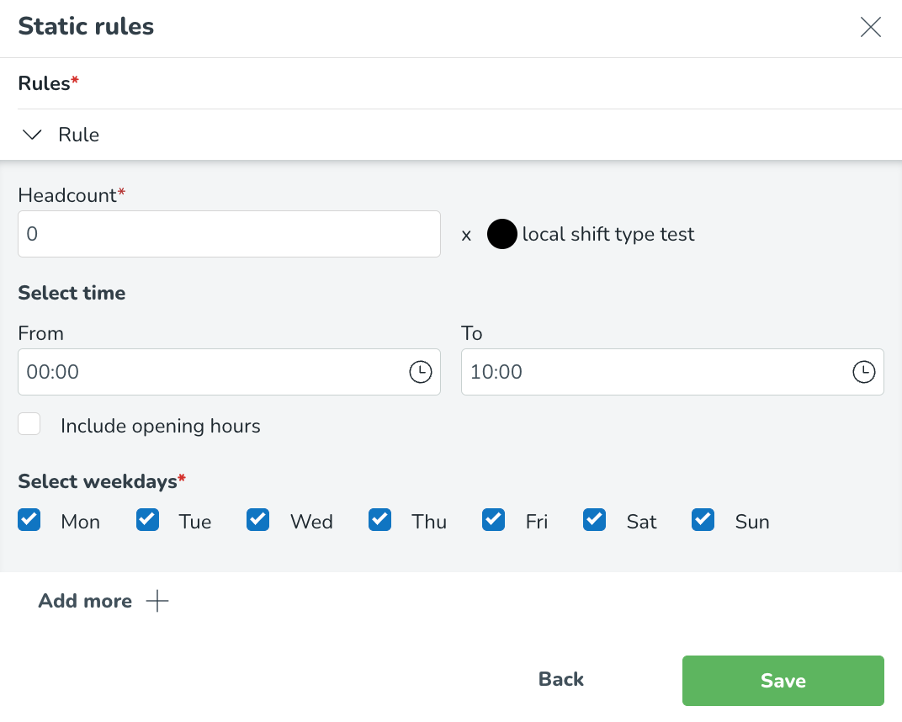
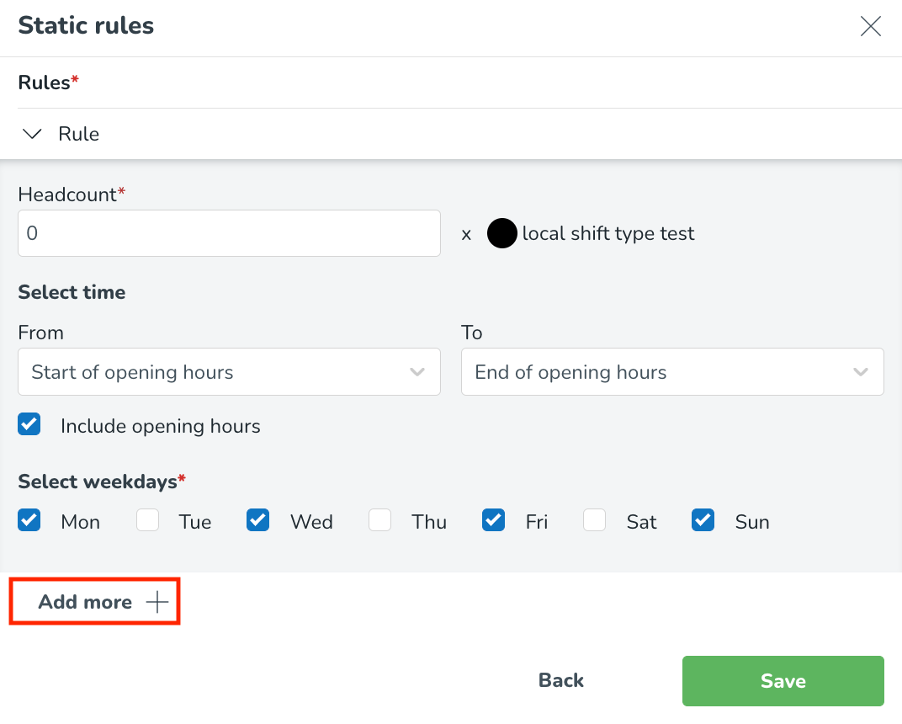
Input the required headcount, and enter the specific hours you would like this rule to apply to.
Static rules can be configured per time of day. This can be done by entering or selecting the specific time frames on a 15 min level.
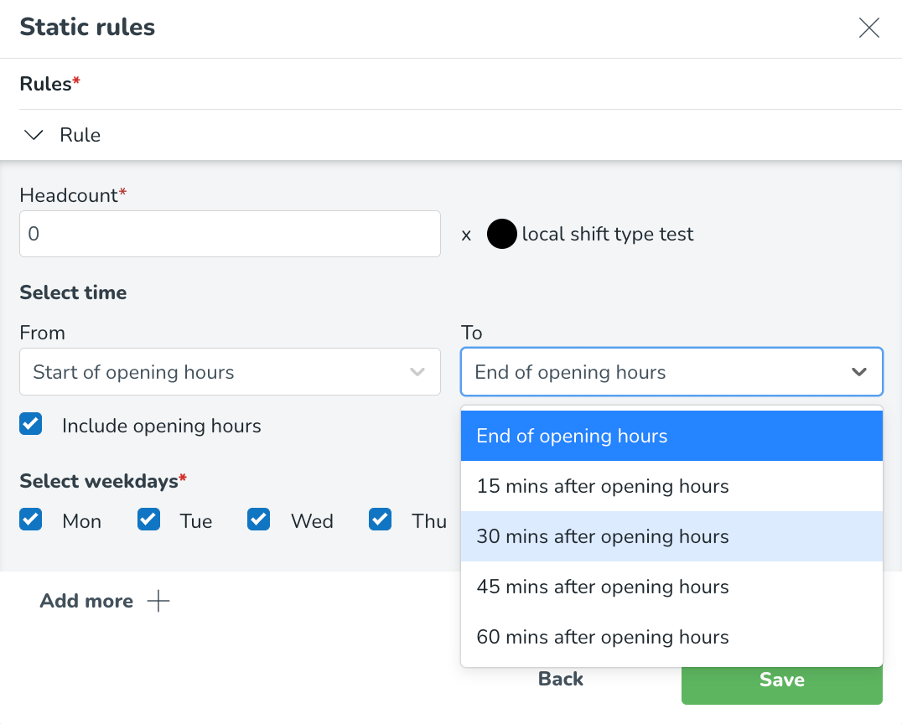
It is also possible to connect the static rules to your opening hours. For example, you need a certain manager 15 minutes before opening hours to 15 minutes after opening hours on site. Read more about how to set up your opening hours here: Opening hours - standard and special hours.
Static rules based on opening hours can be configured by selecting the Include opening hours option and entering the relative requirements to opening hours.
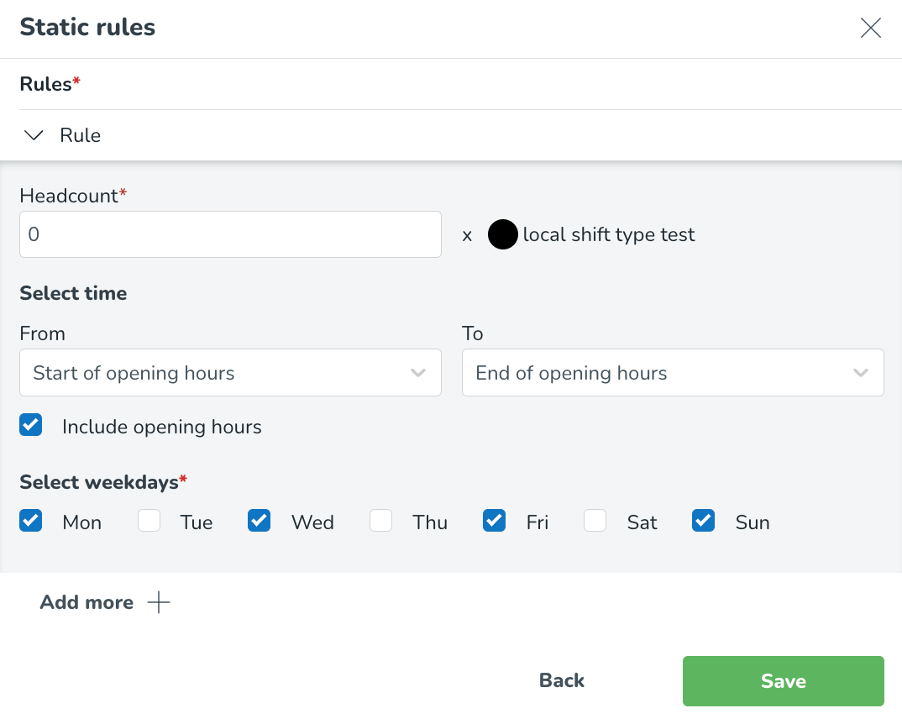
Static rules can also be configured per day of the week. You can choose which days these rules apply by selecting/ unselecting specific weekdays within the Select weekdays* section.
Add additional rules by selecting Add more, and add any additional static rules based on the time of day and day of the week.
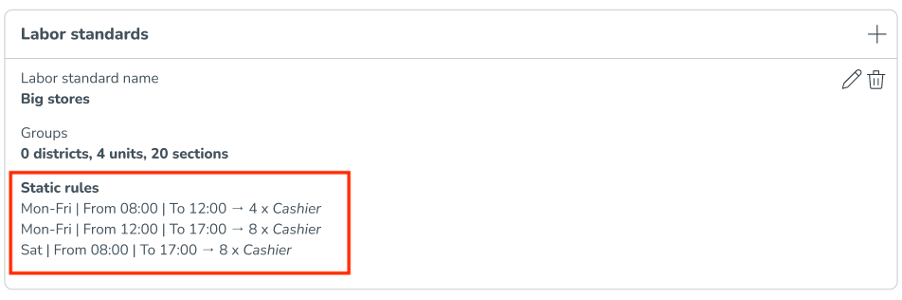
Once all rules are saved, you can see the specific static rules in the labor standards summary.
If you are setting up a static rule on a 15-minute level, for example(you need 1 person from 14:45 to 15:00), and you also have a linear rule that is on a 60-minute level, then the rule with the lowest granularity will be selected in the optimal headcount.
Deleting the Labor Standards
There are three levels of deleting labor standards.
Deleting the optimal headcount variable would delete all underlying labor standards and remove the variable from all display groups. You can do this on the Variable settings page.
Deleting labor standards within the optimal headcount variable can be done by selecting the bin icon next to the relevant labor standard. This will remove the labor rules for the specific groups selected in the labor standard configuration.
Deleting specific rules within a specific labor standard can be done by selecting the bin icon when editing the labor standard. This will remove the specific labor rule from the labor standard. If a labor rule is configured based on a forecast configuration (e.g. transactions) and the forecast configuration is deleted, then the labor rules based on that deleted forecast configuration will be removed as well. Labor rules based on other forecast configurations that have not been deleted will not be removed.
Calculating the Optimal Headcount based on the Labor Standards
Once the optimal headcount variables with the defined labor standards and linear labor rules have been saved, that variable will be visible on the variable settings page. The next step is to add the headcount variables to any additional display groups, aside from the labor display group, and add visibility on the schedule and forecast page.
The optimal headcount for the optimal headcount variable will be calculated based on the relevant forecast and the defined labor rules. Once any changes are made to the forecast or to the labor rules, the changes will immediately be applied, and the optimal headcount will be recalculated.
Visualizing Optimal Headcount - Labor Display Group
Visualizing the headcount of the Optimal Headcount & Labor Standards functionality is captured by the standard display group: Labor.
The Labor display group will automatically be created whenever an optimal headcount variable is created through the Optimal Headcount & Labor Standards - NEW functionality. The optimal headcount variable, as well as any subsequently created optimal headcount variables, will automatically be added to the newly created Labor display group with visibility both in Schedule and Forecast. You can, of course, change the visibility of the variables later on.
Labor Display Group - Graph
The filtering possibilities and comparison with scheduled headcount are only possible in schedule statistics, not yet in the forecast graph and table. In the forecast graph and table, you can only see the individual optimal headcount variables in the new display group.
In the Labor display group, you are able to view total optimal headcount, which is a summation of all optimal headcount variables in the unit you’re viewing, as well as optimal headcount per each individual optimal headcount variable through our new filtering possibility native only to the Labor display group.
By default, you will see the total optimal headcount.
By using the filtering functionality, you can select to view the optimal headcount only for, for example, the cashier headcount variable.
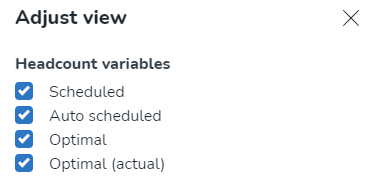
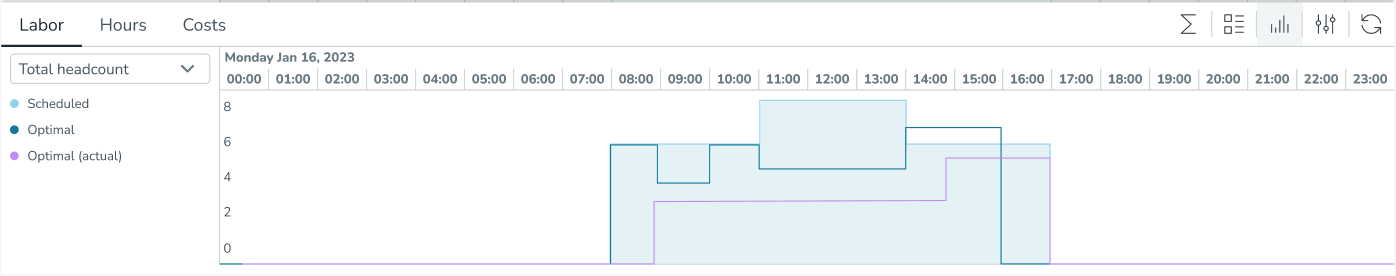
You can also compare optimal headcount to scheduled headcount in total, Auto scheduled headcount, the actual optimal headcount, as well as per each optimal headcount variable. This helps you verify whether you have scheduled enough staff to match the required headcount to allow for more accurate scheduling. This can be done by ensuring that both Scheduled and Optimal are selected in the Adjust view panel.
You can also use the auto-scheduled variable if you use the auto-schedule functionality to automatically create shifts for your employees. The auto-scheduled headcount is comparable to the scheduled headcount and your optimal headcount. It will allow you to understand how many manual changes were made to the schedule after the Auto Schedule was created and whether the existing schedule or the auto-created schedule is more accurate compared to the optimal headcount.
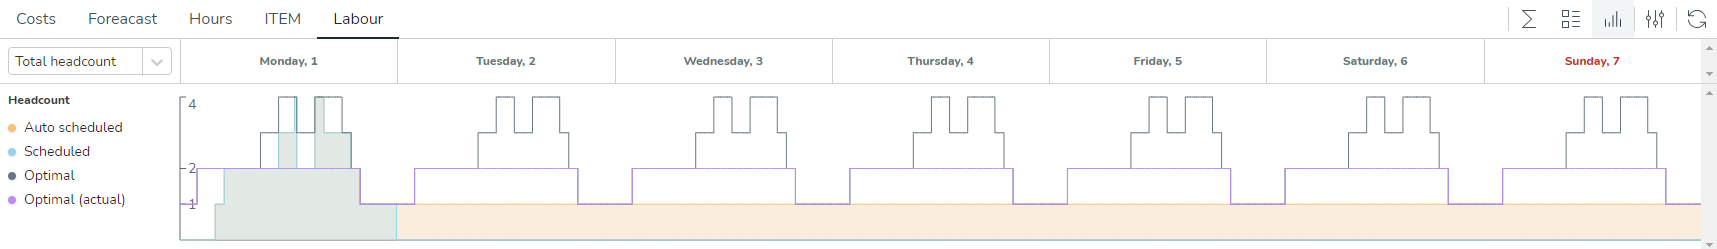
In the graph, the scheduled headcount is represented by the line light blue line; the optimal headcount is represented by the dark green background; the actual optimal headcount is represented by the purple line; and the auto-scheduled headcount is represented by the orange background.
Note that the auto-scheduled headcount is only visible in the schedule view under the Labor display group.
You can also compare optimal headcount based on forecast data to optimal headcount based on actual data in total, as well as per each optimal headcount variable. This helps you verify the difference between optimal headcount based on forecast data (“how many people should I schedule based on my forecast?”), optimal headcount based on actual data (“how many people should I have scheduled based on my actual levels?”) to scheduled headcount. Differences in these two variables would indicate potential forecasting or labor standard issues.
The optimal (actual) headcount curve is only visible in the past, where actual data is available.
In the graph, the scheduled headcount is represented by the line with the shaded background, while the optimal (forecasted) headcount is represented by the dark blue line. The purple line represents the optimal (actual) headcount.
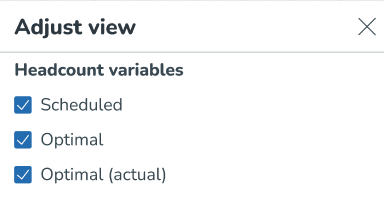
You can select which headcount variables you are interested in viewing within the Adjust view panel.
While the optimal headcount is calculated based on the calculation rules configured for the specific variable and the specific unit in the Optimal Headcount & Labor Standards - NEW configuration, the scheduled headcount is calculated based on the number of shifts scheduled with the shift type matching the configured shift type on the optimal headcount variable in variable settings. Only one shift type can be selected per optimal headcount variable.
In the Forecast tab, we currently only visualize the optimal headcount pereach optimal headcount variable without the filtering possibilities and scheduled headcount visualization.
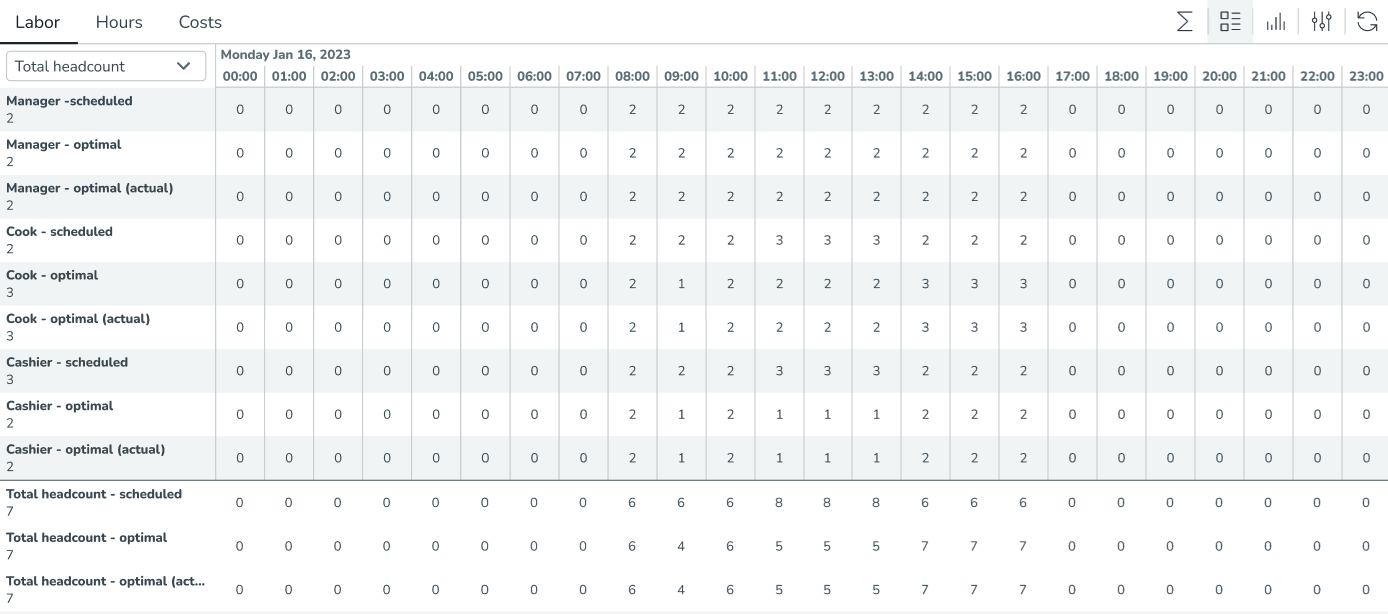
Labor Display Group - Table
The optimal forecast, optimal actual, and scheduled headcount can also be viewed in the table view. When Total headcount is selected, Quinyx visualizes each optimal headcount variable separately, displaying optimal and headcount.
Scrolling to the bottom of the table, Quinyx sums up the total optimal and scheduled headcount if all variables have been selected in the Adjust view panel.
By filtering by optimal headcount variable, or by deselecting either optimal or scheduled in the Adjust View panel, you’re able to customize the table and only view the data that you’re interested in.
Q&A
Can I manage labor standards via API?
We’ve made it possible to create, edit, and delete labor standards via API, making updates faster and scalable.
To enable this, simply configure an External ID on your optimal headcount record — this serves as the link that allows API integration. The External ID should be max 160 characters long, and no special characters or spaces are supported.
Once the External ID is configured, the labor standards can be pushed using our public endpoint. Endpoint details are explained here: Swagger UI.
Labor standards that are pushed to Quinyx via API will be visible in the interface, in the same way as those configured manually.
This update gives operations and integration teams the flexibility to either manage labor Standards manually in Quinyx, or maintain them in an external system and automatically push updates into Quinyx through the API.
What will be worked on next within the new Optimal Headcount & Labor Standards functionality?
With the plan of fully being able to replace the current Static and Dynamic rule configuration as well as Pythia (AI Optimization) labor standard calculations, we'll continue developing additional ways of defining labor needs to allow for more extensive labor standard definitions. This includes migrating over functionalities from current static and dynamic rules, as well as labor rules in Pythia (AI Optimization). Please stay tuned!
What do I need to do if I am currently using Static and Dynamic rules to define my labor needs?
Nothing yet. Over time, we will move over functionalities from static and dynamic rules, where you eventually will have to move over to using the new static and dynamic functionalities. More details will follow. Until then, you can define and continue using your labor needs through current static and dynamic rules as well as the new labor standards.
What do I need to do if I am currently using Labour Standard Calculations in Pythia to define my labor needs?
If you're using Auto Schedule to create your schedules, you'll need to wait until the algorithm can consider these new optimal headcount values as input to properly use this functionality. Until then, you can configure your labor needs in Quinyx, but they will not yet be accounted for within our Auto Schedule solution. Please stay tuned for when and how this will be possible.
 Updated
by
Leigh Hutchens
Updated
by
Leigh Hutchens