Employee Hub - Task compliance report
 Updated
by
Victor Jespersen
Updated
by
Victor Jespersen
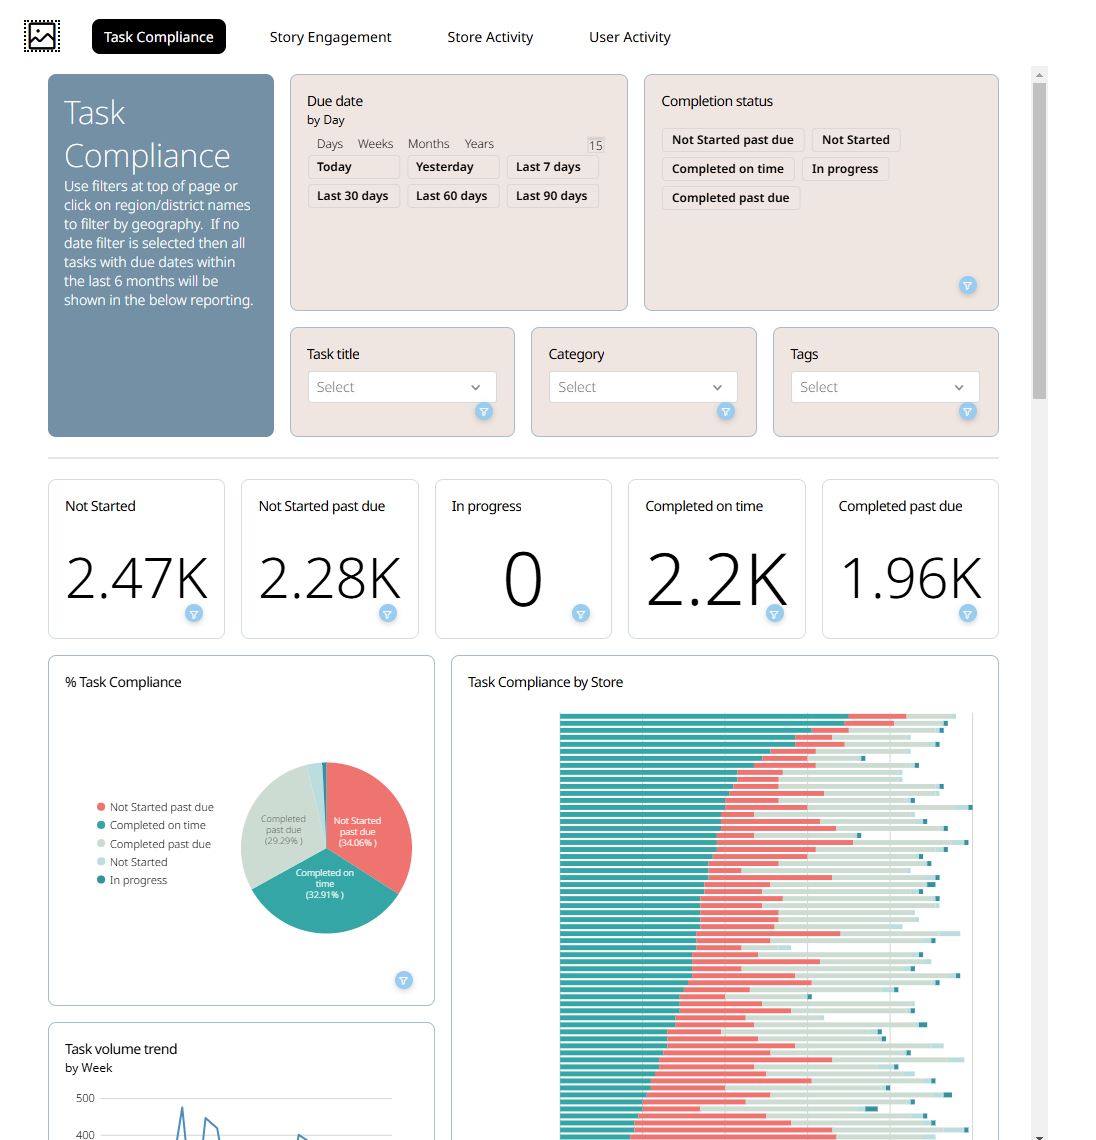
With the Task compliance report functionality, you can get visualized metrics on how well your workforce is complying with the tasks sent out to them. You have several filtering options to drill down on a granular level and can track compliance throughout your organization on region, district, store level, and much more. In addition, you can combine different filters to get specific data. In this article, we will go through the ins and outs of the task compliance report.
Compliance
With the Task compliance report functionality, your group can get visualized metrics on how well your workforce is complying with the tasks sent to them.
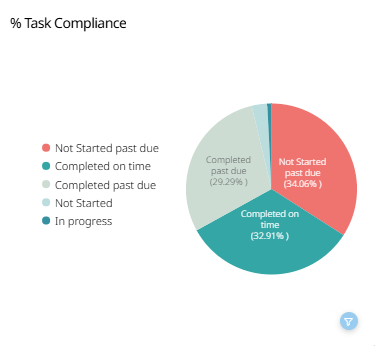
Overall task completion by due date
This will show you the percentage of overall task completions across your organization. You will see the pie chart populated based on the completion categories/ statuses.
Store completions by due date
This will show you a graph of the percentage of overall task completions by due date based on the stores of your organization.
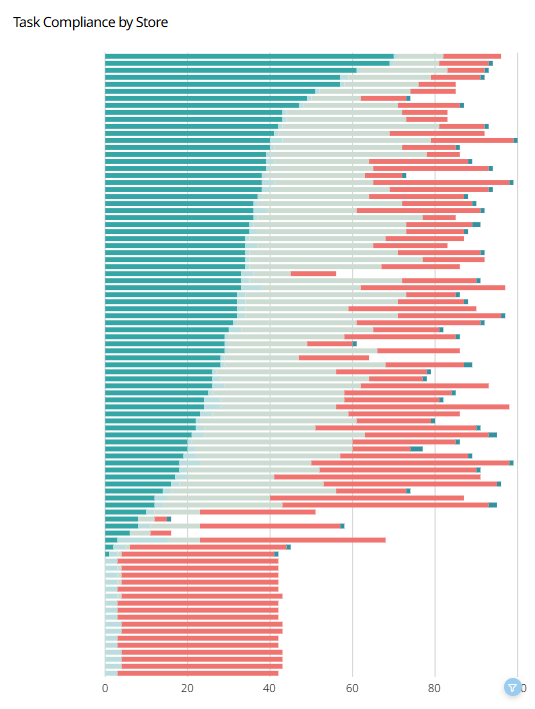
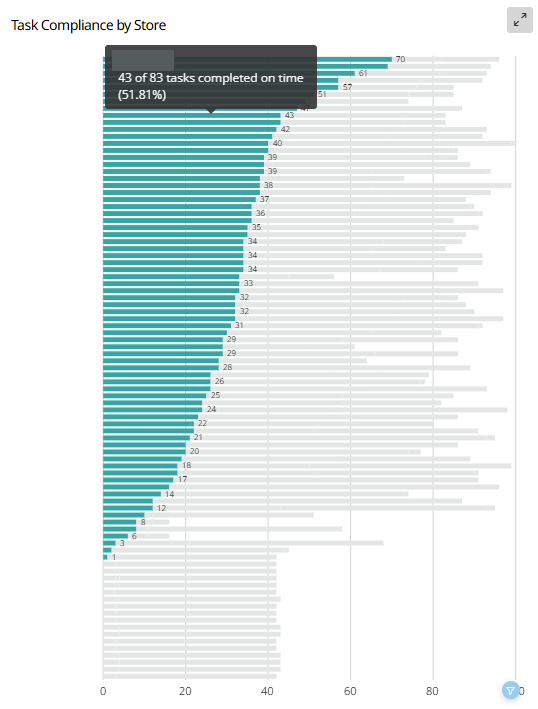
You can see further details per status by hovering over your mouse over the graphs.
The details include:
- The name of the store.
- The status of the task.
- The amount of tasks in the specific status.
- How many percent of the tasks are in the specified status.
Task volume trend (by week)
With Task volume trend, you can get data on peak times when fewer or more tasks are being completed within your organization from week to week. This can be useful when trying to identify patterns or red threads. For example, is there something in particular, like an event that may be happening during a certain week, which increases the number of tasks? You can see the exact amount of tasks by hovering over the line graph.
Region completions by due date
This will show you the percentage of overall task completion based on the regions in your organization. F.ex. your organization might have South Europe as one region, while another could be North East Europe, helping you to track task completion for both regions in one graph.
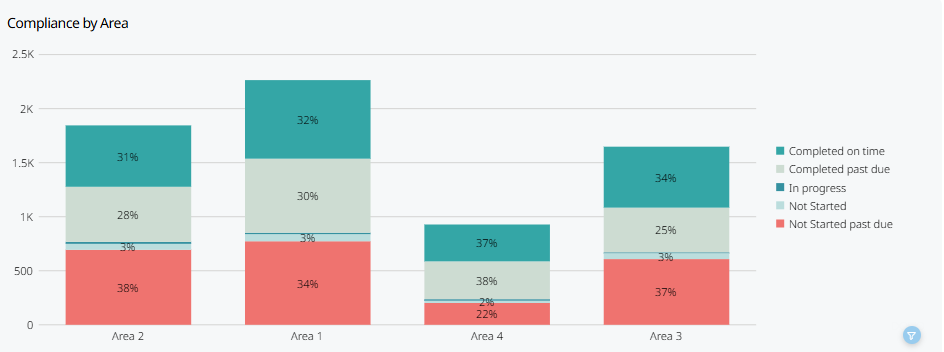
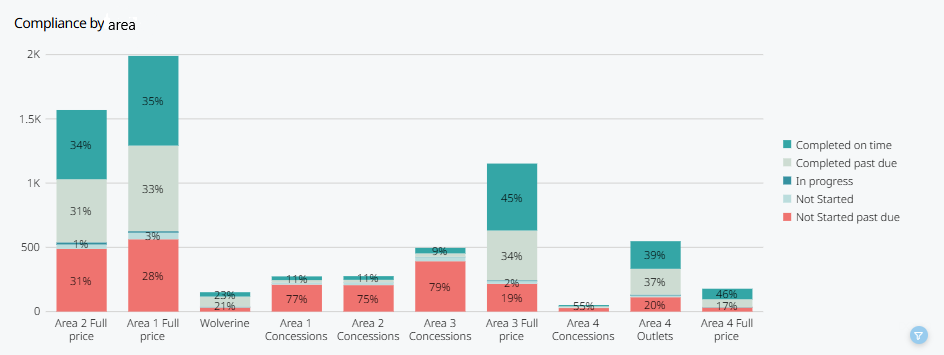
Area completions by due date
This will show you the percentage of overall task completion by due date based on the areas of your organization. Areas are one step more granular than regions and could be anything from different areas of a specific country to several countries. For instance, your organization might have Italy as one area, while another could be South UK & Ireland. This graph will help you to track task completion for both areas.
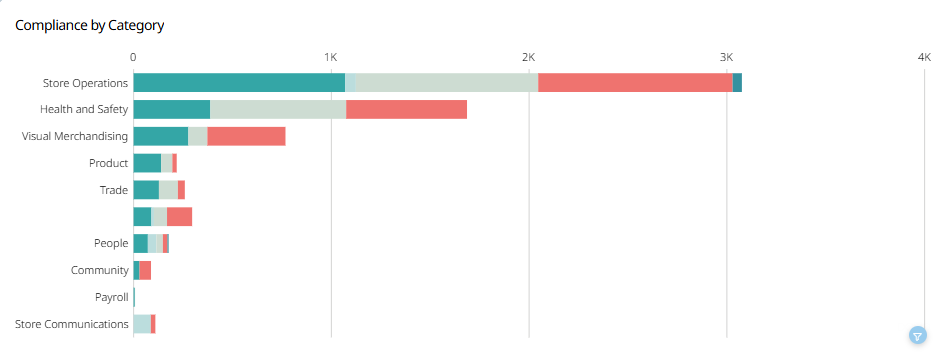
Category task completions by due date
Just like with geographical locations such as regions, areas, or stores, you can get data on the overall task completions by due date based on the categories you have set up across your organization. For instance, you might want to see how your Finance or Customer Service departments are doing in terms of completing tasks within your organization. This graph will help you to track these data within the same graph.
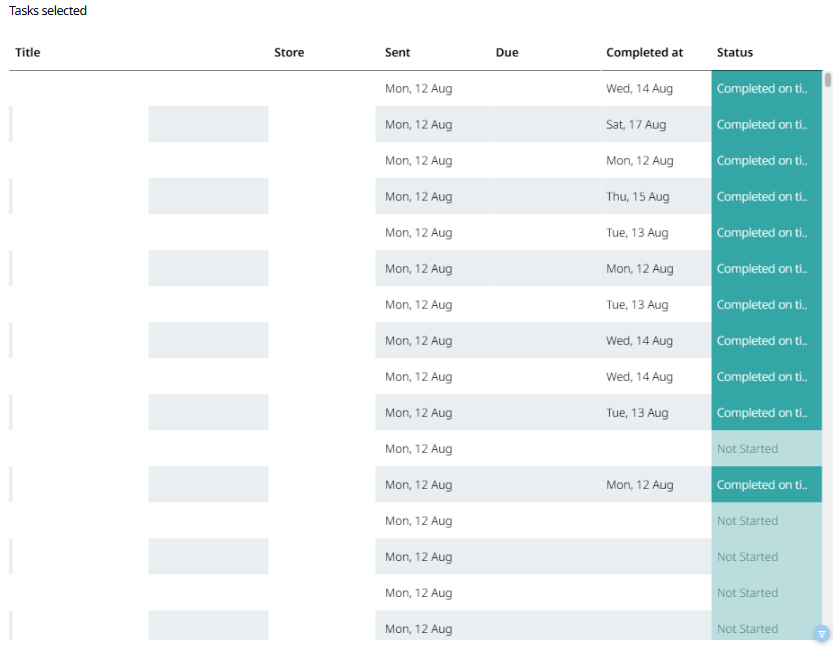
Task overview
In the Task compliance report, you can see an overview of all sent tasks in a list. The list includes information such as the title of the task, the store the task was sent to, when the task was sent to the store, the due date of the task, the date from which the task was completed, and the status of the task. This list aims to help you track which stores received what task on what date and when the said task was completed.
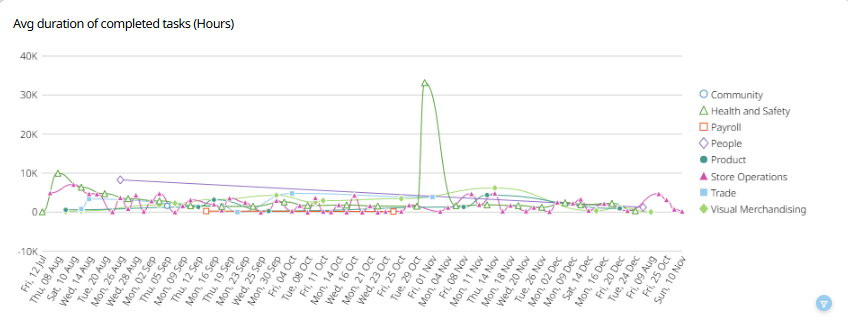
Average duration of completed tasks (hours)
Besides task volume trends, you can also track the Average duration of completed tasks (h) by the due date. With this, you can identify if certain areas/categories of your organization are taking longer to complete tasks than others and figure out why that might be by contacting your stores.
Filters
There are a few filters you can utilize to view a specific part of the report instead of an overall report for the entire organization.
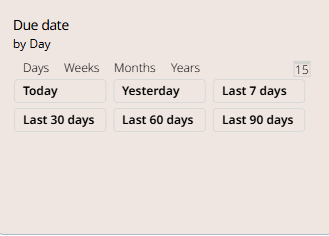
Due date
You can select the time period from which the report should gather data.
There are two ways to select the time period. The first way is to select the preset buttons. By selecting the presets, you can either see today's task compliance report, yesterday's report, a report for the last 7 days, a report for the last 30 days, a report for the last 60 days, or a report for the last 90 days.
The second way is to select the time period manually from a calendar. If you select the calendar icon, a calendar will appear.
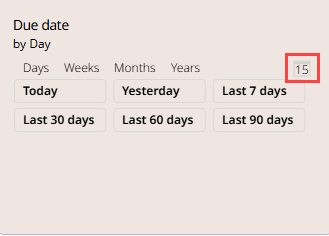
You start with selecting the start date of the period and then the end date.
Once the period has been selected, the report will automatically reflect the data for the specified period. If you want to go back to the presets, you can select the Presets text.
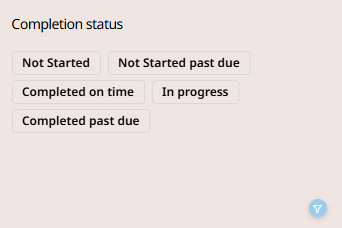
Completion status
The idea with the completion status data is to show you or your group with access to Reports on the level of compliance by task completion by various metrics. Currently, you can track the level of completion based on the following:
- Completed on time: If a task or several tasks within your organization have been completed on time, they will be populated in the different charts as green.
- Not started past due: If a task or several tasks within your organization haven't been started and are past their due date, they will be populated in the different charts as red.
- Completed past due: If a task or several tasks within your organization have been completed past the set due date, they will be populated in the different charts as light green.
- Not started: If a task or several tasks within your organization have been created but haven't been started yet, they will be populated in the different charts as grey.
- In progress: If a task or several tasks within your organization are in progress, they will be populated in the different charts as dark green.
You can use these filters by simply selecting the button with the name of the completion status you wish to see.
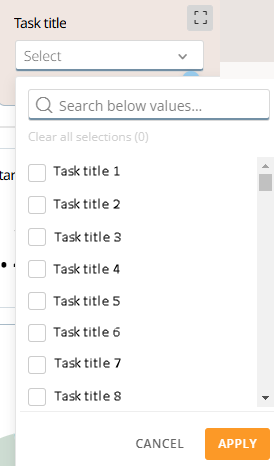
Task title
You can select one or multiple task titles to filter on. For each task created, a separate child task will be sent to all recipients. So, for example, if you create a task and send it to 10 recipients, 10 separate instances for that specific task will be created and sent to each recipient. This filter will help you to get an over of single or multiple tasks by filtering it by its name.
You can find all of the task titles by selecting the search column in the task title window.
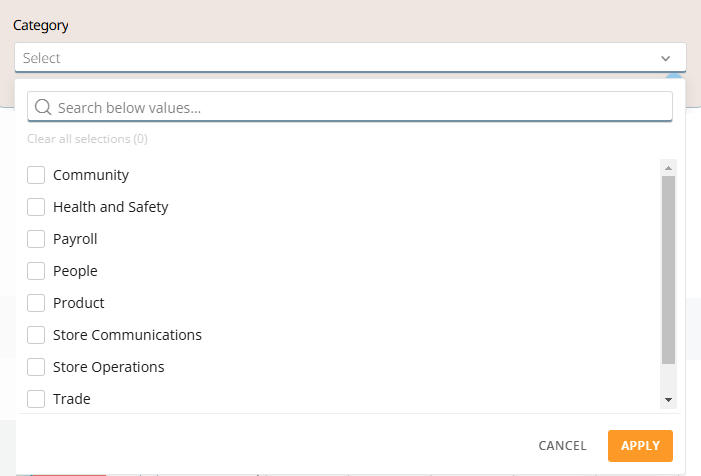
Category
You can filter tasks with the existing categories used in the Employee Hub. You can search for the categories by selecting and typing the category name within the Search below values... field or by scrolling through the list of existing categories and checking the checkbox to the left of the category name.
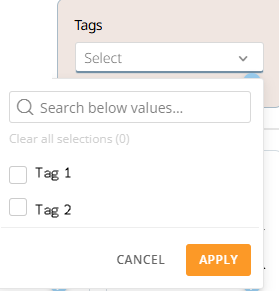
Tags
Similar to the category filter, you can also filter on existing tags. You can search for the tags by selecting and typing the tag name within the Search below values... field or by scrolling through the list of existing tags and checking the checkbox to the left of the tag name.
Advanced filtering
Now that we have looked into the different graphs and basic filter options, let's look at more filtering capabilities in the task compliance report.
Filter on specific objects
You can select different objects in the graphs to filter on more specific data than the filters presented above. The objects that can be selected are but not limited to:
- Store.
- Region.
- Area.
- Task.
- Task status.
- Category.
- Date.
This filter will be applied to all graphs visualizing the objects in real time. You can remove the filter by either selecting the task status again or by selecting the funnel icon.
By using the filter settings, you can further filter data for specific situations, such as the actions made on a specific date, the task compliance of a specific store, the task compliance of specific regions of the organization, etc, by simply selecting the name or object within the report.