Employee Hub - Store activity report
 Updated
by
Victor Jespersen
Updated
by
Victor Jespersen
With the Store activity report functionality, you can see metrics on your workforce activity in the Employee Hub. You have two filtering options to drill down on a granular level and can track activity throughout your organization on region, district, area, and much more. In this article, we will go through the ins and outs of the store activity report.
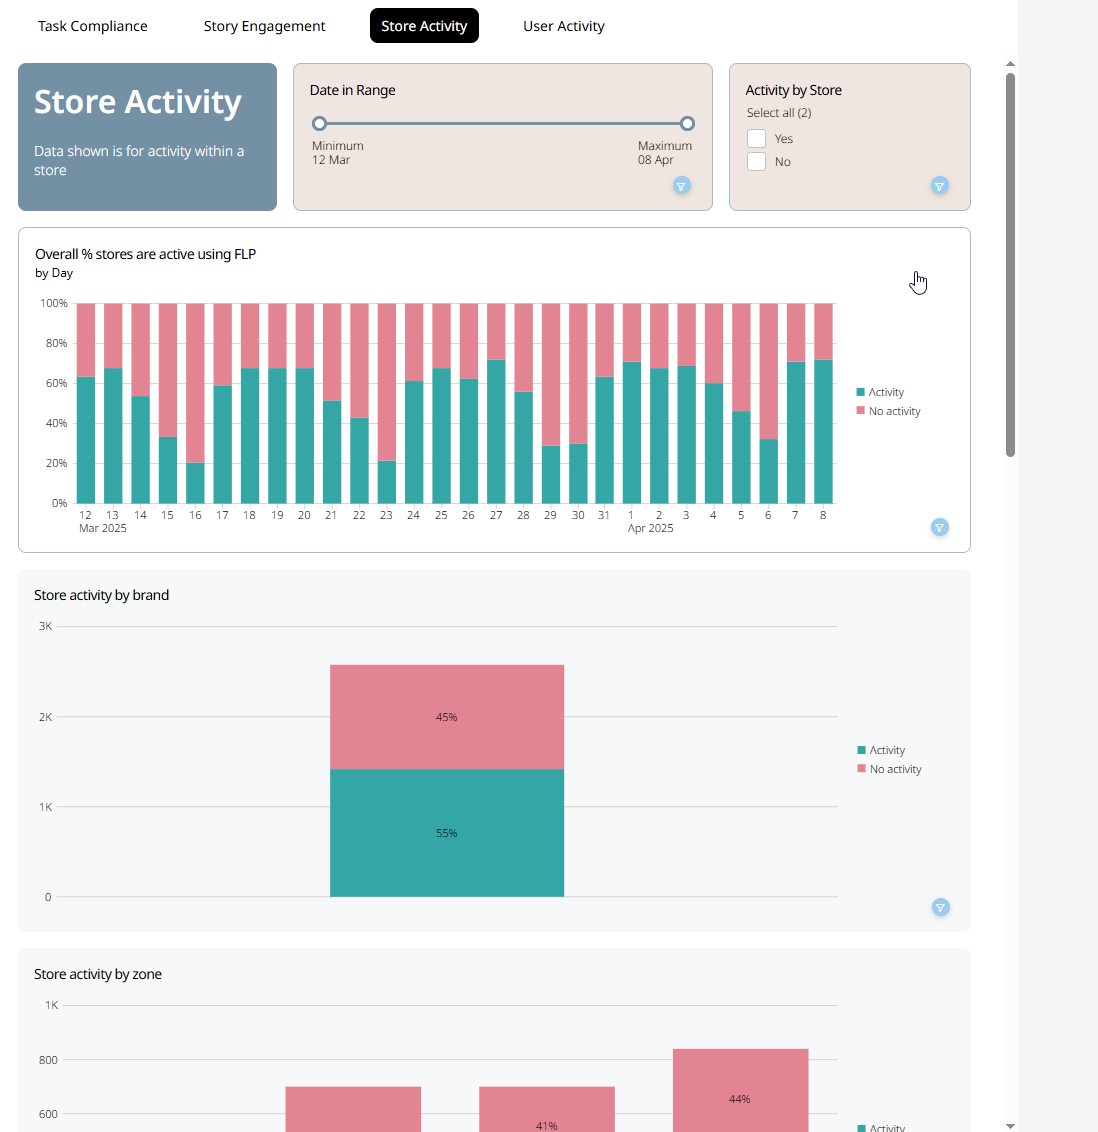
Store activity
With the Store activity report functionality, you can see metrics on your workforce activity in the Employee Hub.
Overall % stores are active using EH
This will show you the percentage of stores that logged in to the Employee Hub per day. The red graph indicates the percentage of stores that weren't logged in, and the green graph indicates the percentage of stores that were logged in during the day.
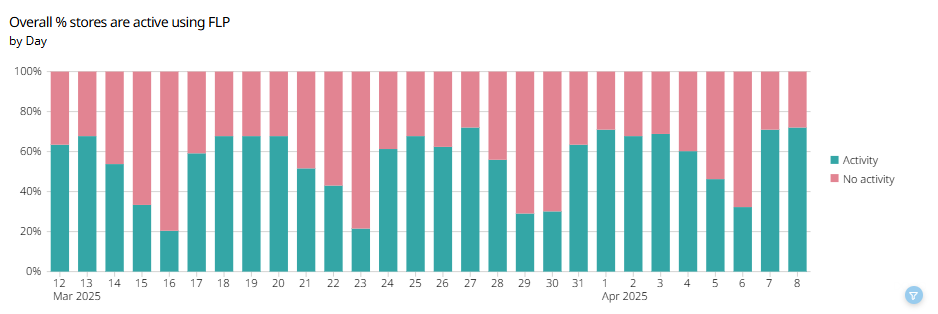
You can see further information by hovering over the graph with your mouse. Within the details, you can find information such as:
- Date and month
- How many stores logged in/ didn't log in
- The exact percentage of stores the graph represents
Store activity by brand
This will show you the total percentage of stores active in the Employee Hub during the selected period by brand. The red graph indicates the percentage of stores that were inactive, and the green graph indicates the percentage of stores that were active during the period.
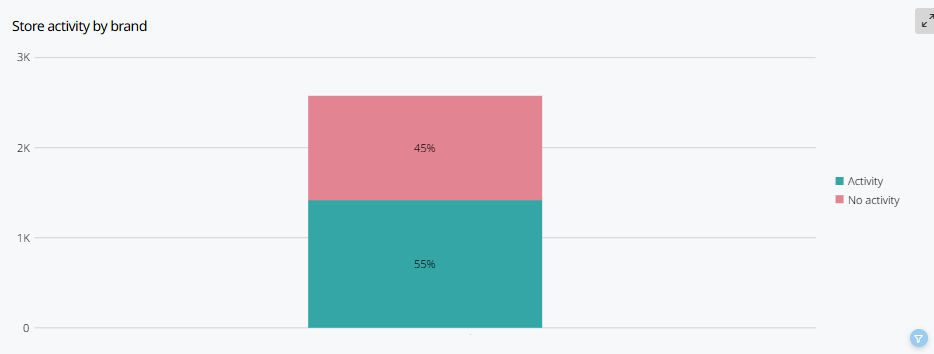
You can see further details by hovering over the graph with your mouse.
The details include:
- The name of the brand
- The number of days out of the total amount of days where the stores were active/ or inactive
- The exact percentage the graph represents

Store activity by zone
This will show you the total percentage of stores active in the Employee Hub during the selected period by area. The red graph indicates the percentage of stores that were inactive, and the green graph indicates the percentage of stores that were active during the period.
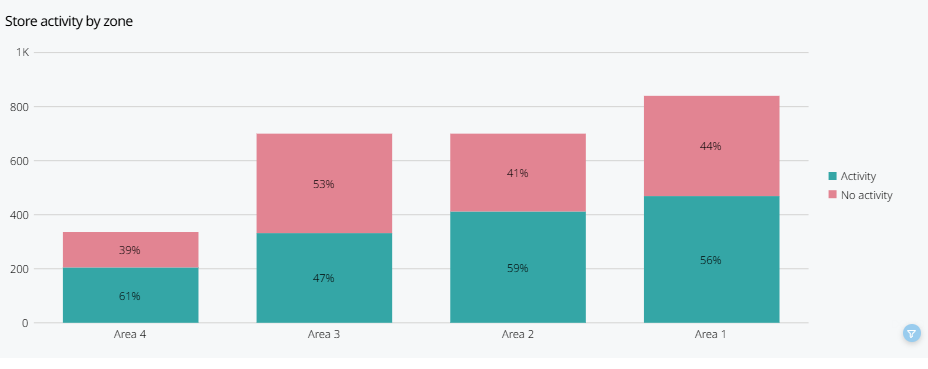
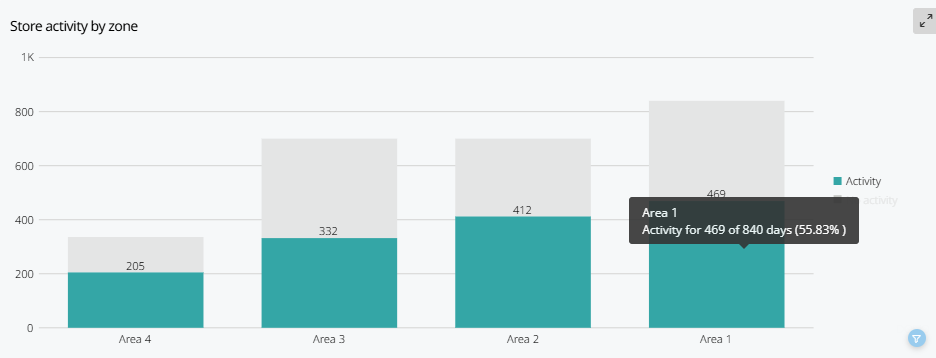
You can see further details by hovering over the graph with your mouse.
The details include:
- The name of the area
- The number of days out of the total amount of days where the stores were active/ or inactive
- The exact percentage the graph represents
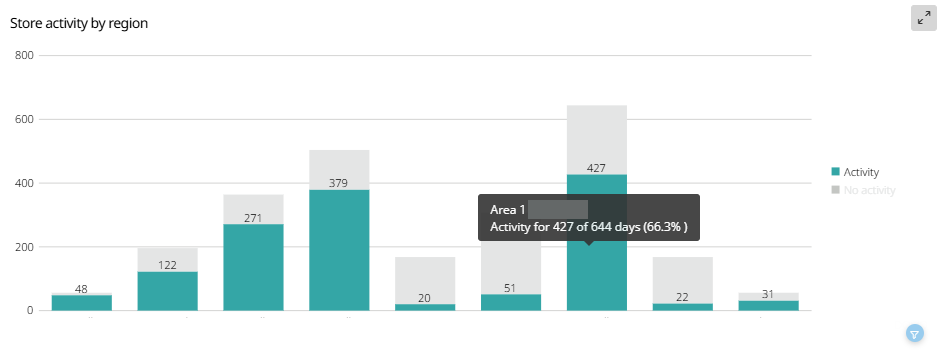
Store activity by region
This will show you the total percentage of stores active in the Employee Hub during the selected period by region. The red graph indicates the percentage of stores that were inactive, and the green graph indicates the percentage of stores that were active during the period.
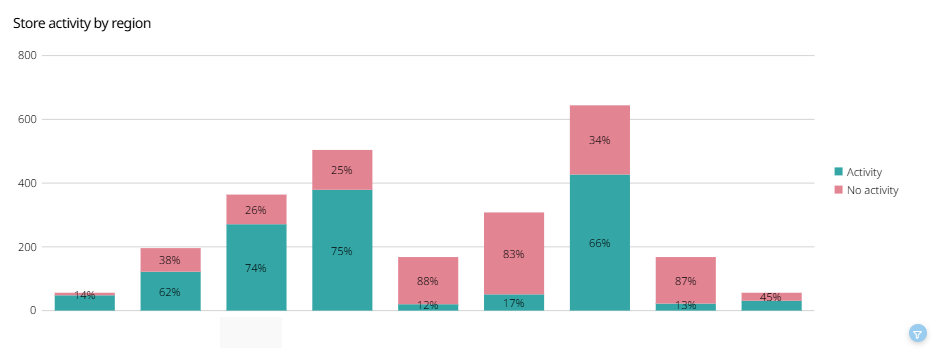
You can see further details by hovering over the graph with your mouse.
The details include:
- The name of the region
- The number of days out of the total amount of days where the stores were active/ or inactive
- The exact percentage the graph represents
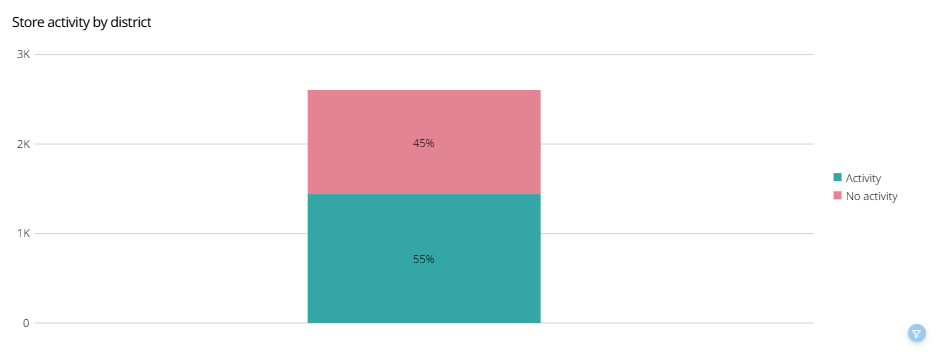
Store activity by district
This will show you the total percentage of stores active in the Employee Hub during the selected period by district. The red graph indicates the percentage of stores that were inactive, and the green graph indicates the percentage of stores that were active during the period.
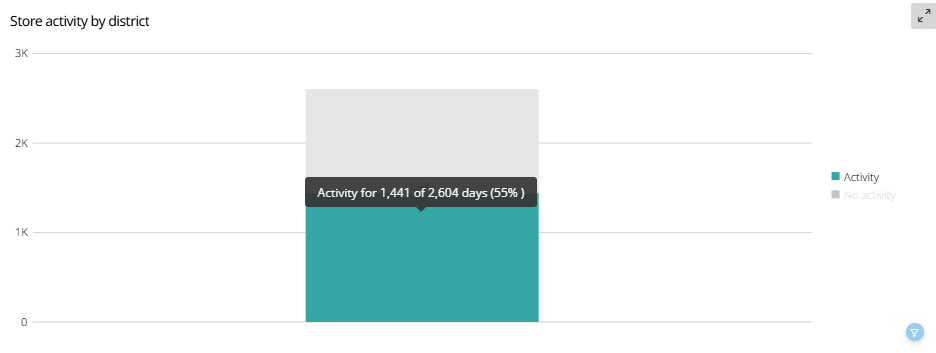
You can see further details by hovering over the graph with your mouse.
The details include:
- The name of the district
- The number of days out of the total amount of days where the stores were active/ or inactive
- The exact percentage the graph represents
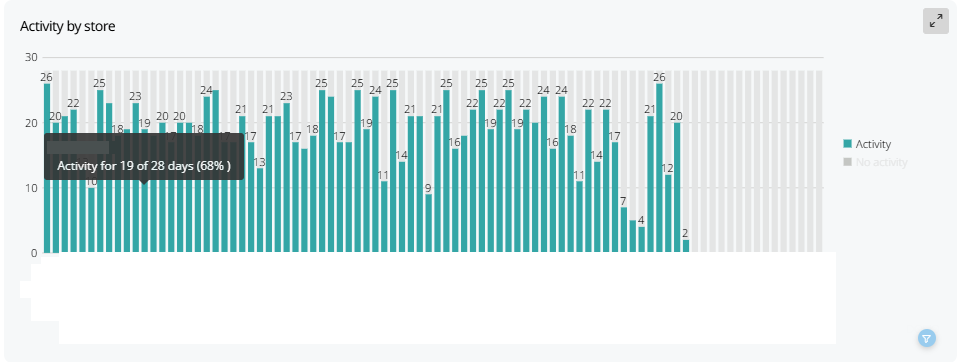
Activity by store
This will show you the percentage of activity in the Employee Hub during the selected period per store. The red graph indicates the percentage of stores that were inactive, and the green graph indicates the percentage of stores that were active during the period.
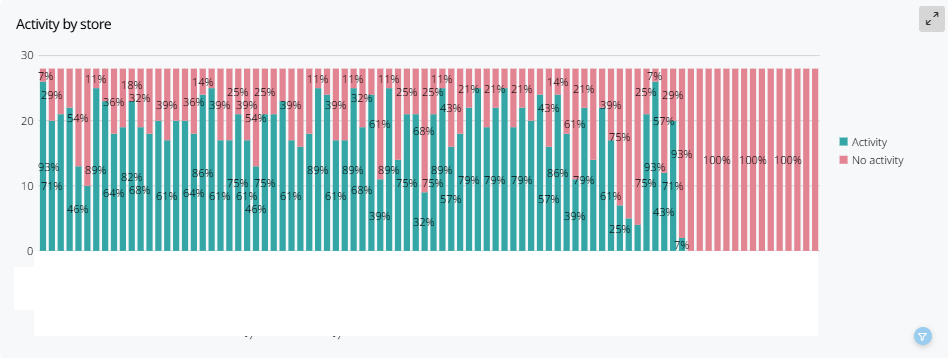
You can see further details by hovering over the graph with your mouse.
The details include:
- The name of the store
- The number of days out of the total amount of days where the stores were active/ or inactive
- The exact percentage the graph represents
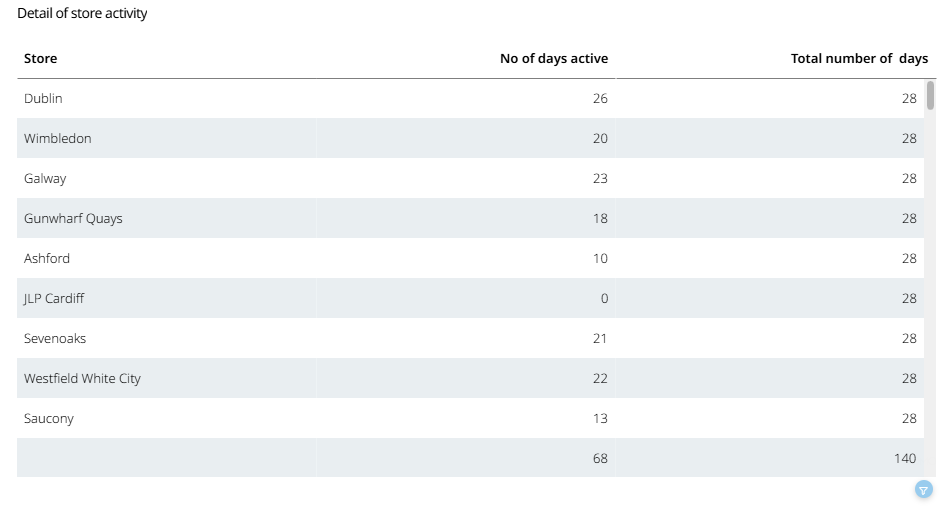
Detail of store activity
This will show you a list of store activity in the Employee Hub during the selected period per store. You can find information such as:
- The name of the store
- Total active days in the Employee Hub
- Total number of days
Filters
There are two filters you can utilize to view the activity of your organization. The filters will help you narrow down the details into more digestible values and periods depending on your needs.
Date in range
You can select the time period from which the report should gather data by sliding the two dots seen in the picture below.
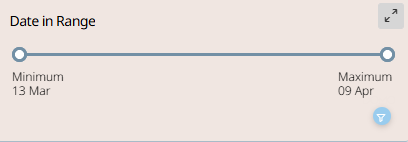
The filter will show you the start and end date of the period in real-time while you are moving the dots.
Activity by store
You can filter whether you only want to see data for active or inactive periods for the stores.
Filter on specific objects
You can select different objects in the graphs to filter on more specific data than the filters presented above. The objects that can be selected are but not limited to:
- Store
- Region
- Area
- Brand
- Date
- Activity/ No activity
This filter will be applied to all graphs visualizing the objects in real time. You can remove the filter by either selecting the object again or by selecting the funnel icon.