Forecast

Updated by Leigh Hutchens

This article relates to Classic.

The Forecast view under the Forecast tab shows an overview and complete forecast for the month. Here you can select which forecast variable and which budget (if any) is to be compared. The department can be specified in all forecast tabs for department-specific forecasts. It is possible to adjust the key figures percentage-wise, as well as to follow up the outcome of actual results compared with forecast.The Forecast view below also shows how many hours that Quinyx is to schedule based on forecast/rules and how many hours are actually scheduled. It is also possible to view the actual outcome of the number of hours.

There are several options in respect to how you can show the forecast and what it will be based on. Examples of forecast variables are sales or number of visitors.Select the forecast variable in the first drop-down menu, then select which budget you want to compare with (if applicable) and for which period and department.You will then see an overview of sales against budget, and actuals.

The buttons on the right in this view allow you to show the data in different ways:

Switch between accumulated information for the month and daily data.
Show a diagram of the forecast/actual outcome/budget.
Create an Excel report.
Configure which columns are to be visible in the forecast. Under Misc. you can also set to total your variables per week and use the accumulated trend. This functionality is disabled by default. Forecasts are totalled per week and related calculations will be week-based in accordance with ‘First day of the week’ - the setting on the unit card.

Click here to update more variables from current outcomes at the same time, which is useful if your forecast is based on more than one. You have the option to select a period with current outcomes and copy this as a forecast to the selected period. 

When the forecast is updated in forecast view, Quinyx will look at the closest similar weekday. However, this may not always be useful, such as on public holidays. This function allows you to copy in outcomes from 23 December - 28 December for the exact date. Maybe you are closed on Christmas Eve and Christmas Day, and predict similar figures for the other days, and want to look at the date and not the closest comparable weekday.

  • Select the period you want to copy the current outcome from
  • Select which start date you want for the forecast
  • Select from which variable the data is to be copied/updated from
  • Select if you want to adjust as a percentage the copied values (any)

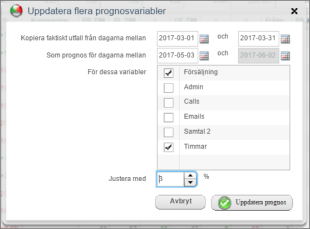
Update the daily reports so that they agree with the monthly forecast and any percentage adjustment. There are several different ways of creating a forecast and each time you make a change. Click the Update button.

At the very top you will see an overview of the month’s data.

On the left you can compare the monthly forecast against the previous year’s outcome, a budget, actual outcome and expected (actual outcome of sales [or selected forecast variable] from the start of the month up to yesterday + sales forecast from today until month end).

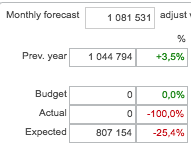
In the middle you can compare the forecast’s optimal number of hours in the schedule against your plan, budget, actual and expected (actual outcome of hours from the start of the month up to yesterday + scheduled hours from today until month end) hours.

You can then compare the forecast index (sales [or other forecast variable] per hour) against plan, budget, actual outcome and expected index.

On the far right side you can compare forecasted salary costs against plan, budget, outcome and expected (actual outcome of salary costs from the start of the month + scheduled staffing costs from today until month end) costs.You can also view the size of the share of sales going towards salaries, under the column salary%. 

There are different ways to create your forecast and distribute the data in the forecast. The following buttons can help you to do this.Enter the forecast:

Distribute the stated monthly forecast according to the previous years’ percentage distribution of the outcome during the equivalent period

Distribute the stated monthly forecast with the hourly matrix distribution key. The hourly matrix is defined under the Budget tab (standard values in the hourly matrix are 20% distribution M-F, 12.5% between the hours of 09:00-17:00)

Make an even distribution of the stated monthly forecast across all the days. (If the value exists in the hourly matrix, they are divided according to it)

Calculate the forecast:

Copy the 6-week average of the outcome to the equivalent daily forecast. The 6-week average is shown in column ‘6 weeks’, and represents the average sales for the equivalent weekday 6 weeks in the past.

Copy the outcome for the equivalent month for the previous year to the current year’s monthly forecast.

Copy the selected budget to the monthly forecast (and according to the hourly matrix, if defined)

Reset the monthly forecast.

Add note. This is useful in future to note unusual events that have affected the outcome and consequently the forecast. If for example, a large sale began on a particular Monday, making the sales figures double what they are for a normal Monday, you can write a comment in order to remember this.

In order to get started with the module, it is very useful to have at least one years’ outcome data available for import, even if it is not ultimately necessary. Then enter the actual data via the Web Service API.If the actual data is unavailable, it is good to begin with a percentage-wise distribution in the hourly matrix. Then add a forecast in the total or write it in per day and distribute it according to the hourly matrix.For the next month you can then for example copy all outcomes by Updating several forecast variables, 3rd month you can base the forecast on a 6-week average.Columns in  the Forecast view

Column

Description

Date

Day’s date

6 weeks

An average for the selected day (same weekday) during a 6-week period

Prev. yr

The outcome of the same day the previous year (same weekday to the closest date)

Forecast

Forecast for the day

%

Difference between previous year’s outcome and forecast, in %

Actual

Actual outcome at end of calendar day

Δ Forecast

Difference between forecast and actual

%

Difference between forecast and actual, in %

Δ Prev. yr

Difference between previous year’s actual outcome and outcome

%

Difference between outcome and previous year’s actual outcome, in %

Comments

Shows any comments/notes for the selected day

F-HRS

Forecast hours.  Optimal hours for the day. Calculated by Quinyx based on the rules you have provided.

PL-HRS

Planned hours. Number of scheduled hours, including scheduled shifts that are not yet staffed.

Δ

Difference between forecast hours and planned (scheduled) hours

A-HRS

Actual hours. Number of actual hours worked.

Δ

Difference between actual and forecast hours

Δ

Difference between actual and planned hours

Absence

Number of absence hours that day (note that this only calculates absence types with an associated salary type)

FCST

Forecast salary costs. The salary cost must be entered into Quinyx manually as an individual variable using the 'Salary Cost' type. It is not calculated automatically. The variable must then have data associated to it.

PL-CST

Planned salary costs according to schedule

Δ

Difference between the forecast salary costs and planned (scheduled) salary costs

A-CST

Actual outcome of costs based on hours worked

Δ

Difference between actual and forecast salary cost

Δ

Difference between actual and planned salary cost

F-IDX

Forecast index. Efficiency. E.g. sales per hour worked according to forecast.

PL-IND

Planned sales per hour worked according to planned schedule

A-IND

Outcome efficiency. E.g. outcome of sales per hour according to actual outcome.

Δ

Difference between actual index and forecast index.

Δ

Difference between actual index and planned index.


How Did We Do?