Advanced Analytics - Hours Statistics Dashboard

Introduction
This article provides a comprehensive breakdown of the new "Hours Statistics" dashboard available via Advanced Analytics, and the insights made possible around the core performance metrics for you and your organization.
The "Hours Statistics" dashboard is a direct evolution of the "Scheduled vs Worked Hours" dashboard and will replace it, offering additional granularity and new data points to help you take action where needed.

How does it work?
Where the "Scheduled vs Worked Hours" dashboard provided an isolated view on the performance of scheduled hours versus worked hours to enable an aggregate view of global, district, and unit-level trends across your organization, the new "Hours Statistics" dashboard does this and then some.
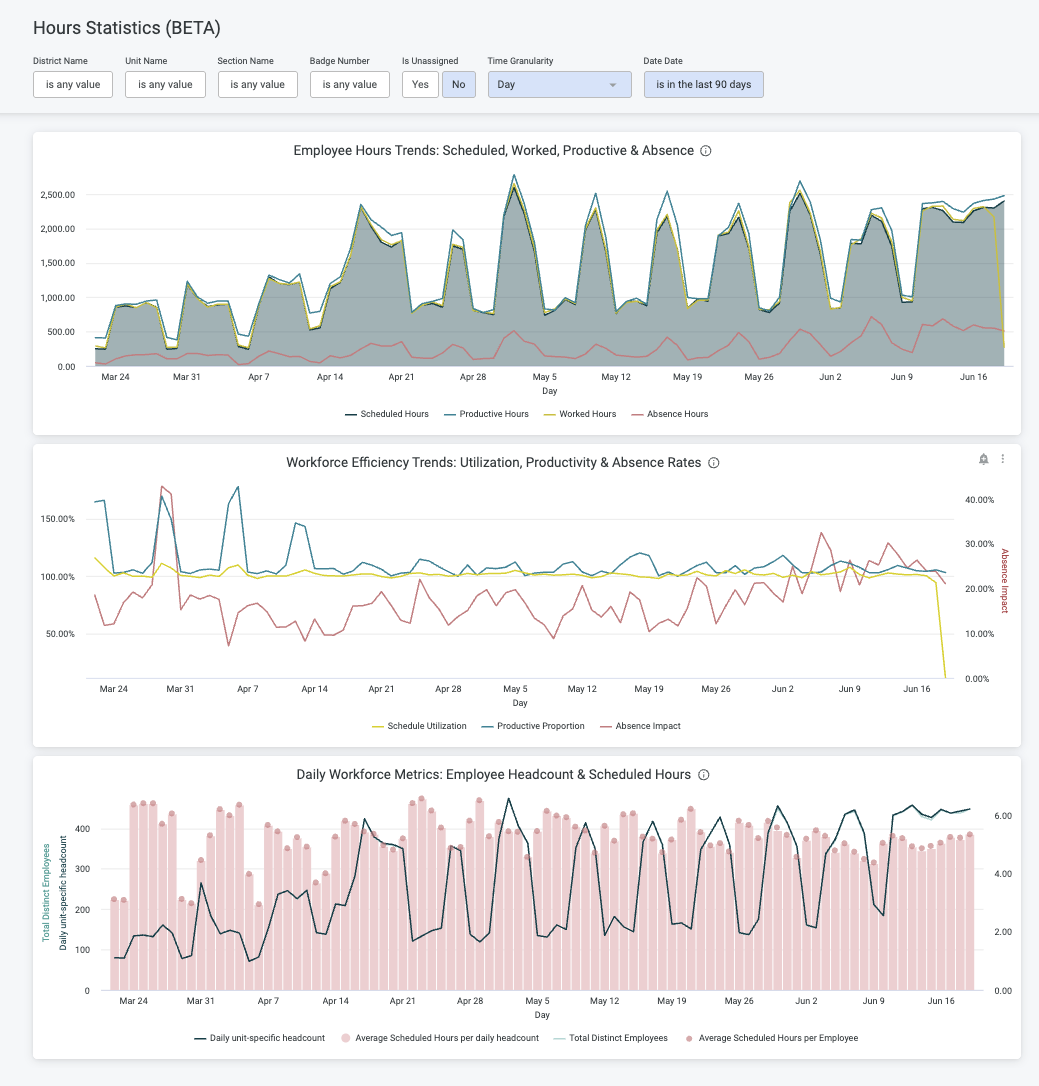
The "Hours Statistics" dashboards include two new insights: productive hours and absence hours - consolidating scheduled, worked, productive, and absence hours into a single view, enabling new multi-metric combo visuals to replace side-by-side charts, making variance and productivity gaps obvious at a glance.
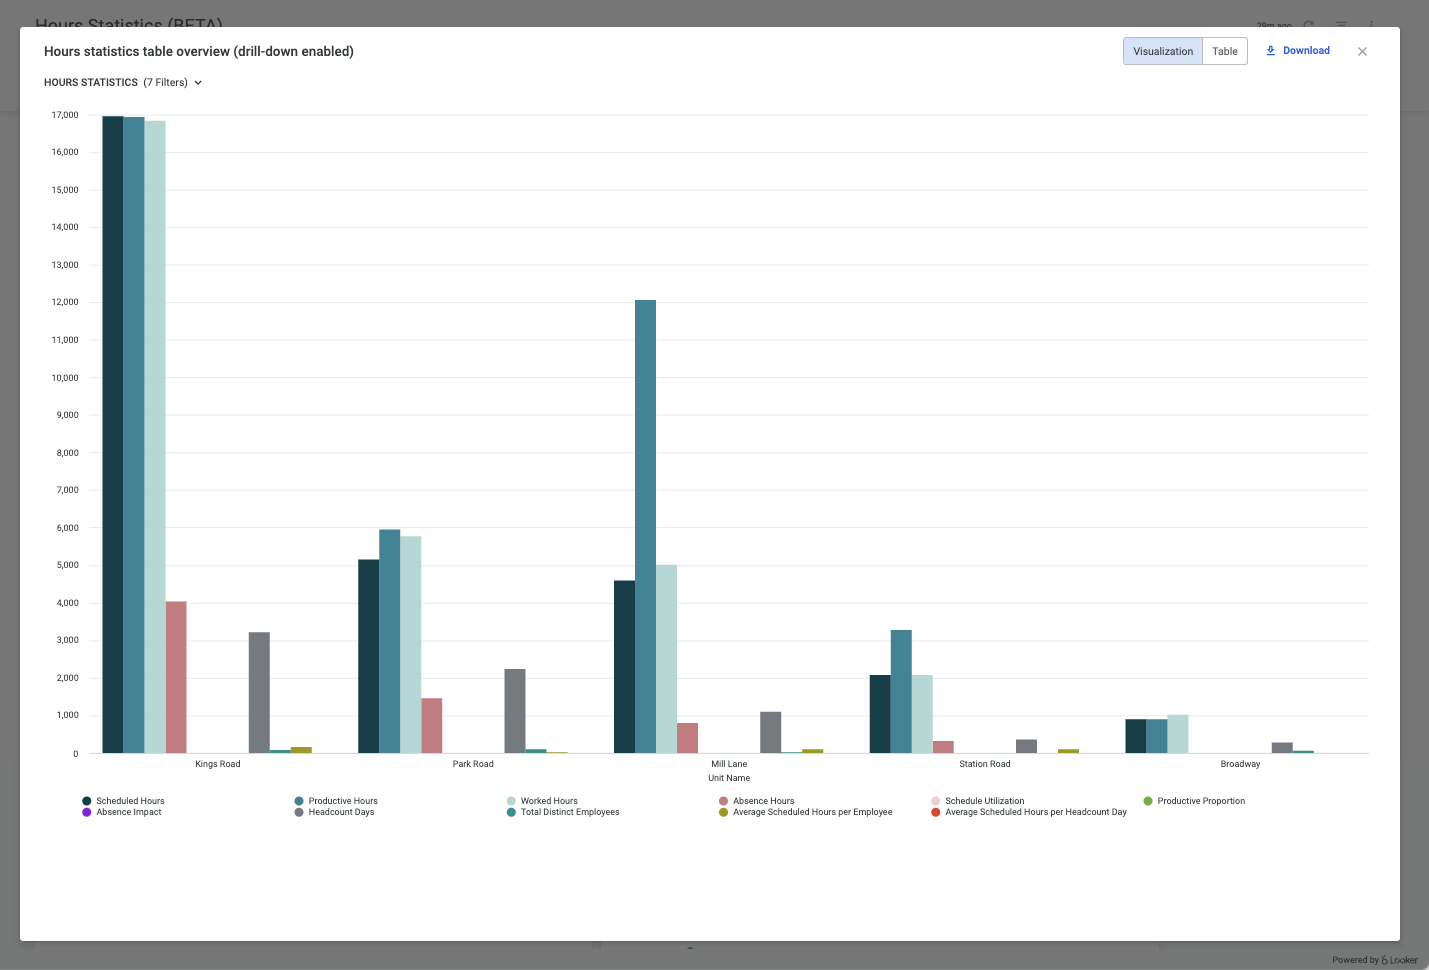
We've also enabled additional granularity to allow users to more easily explore their full organization hierarchy. Where before you were limited to a district and unit view, now you can drill deeper from a section to an individual badge number within a single view. Interactive filters and cross-chart highlighting mean a single click on a district bar instantly refreshes every other visual, while a new employee table (exportable to CSV) is available at the bottom for deeper insights.
With the new "Hours Statistics" dashboard, you can now:
- Work with new productive hour and absence hours insights, cross-referencing them with the existing scheduled and worked hours aggregate data.
- Drill deeper with section and employee-level granularity to better explore your whole organization hierarchy.
- Take action quickly, with improved data visualizations and multi-metric combo visuals to quickly surface productivity gaps.
All to enable more powerful insights, with improved visuals and deeper granularity, all in the same space.
Unlocking Actionable Insights
The goal of this new dashboard is to provide end users with actionable insights, utilizing the necessary data points and granularity to effectively monitor organizational health and take informed action within your organization. Here are just a few examples of the insights made available:
- Spot chronic understaffing early. Area and line overlays reveal units whose productive hours consistently trail scheduled hours by >10 % for three consecutive weeks, flagging a systemic scheduling issue before service levels dip.
- Isolate absence hotspots. Drill from district to employee to identify badge numbers whose absence-to-scheduled ratio spikes after roster changes, helping managers target coaching or wellbeing interventions instead of blanket policy changes.
- Optimize overtime costs. Cross-filter on worked-minus-productive hours and view the downloadable employee table to see which staff are clocking in early or lingering post-shift without output, giving finance teams precise names (and time stamps) for corrective conversations.
- Validate labor-mix decisions. Compare productive hours against sales or foot-traffic feeds (added as a secondary axis) to prove that last month’s shift of labor from mornings to evenings produced the desired uplift; evidence the old dashboard simply couldn’t surface.
By combining richer data with drill-anywhere analytics, the “Hours Statistics” dashboard transforms static reporting into a living control panel for proactive labor planning, compliance, and cost control.
Extra Details
The new dashboard was designed with better transparency, and better data accuracy top of mind. Using the same calculations as in the interactive Scheduled Statistics metrics - we've included a detailed definition for each metric below, to explain each calculation in practice, highlighting any possible variables:
Scheduled Hours | Scheduled hours reflect the total duration of shifts that are marked as “scheduled” based on shift settings.
|
Productive Hours | Productive hours capture scheduled shift time that is marked as productive, helping measure actual output potential.
|
Worked Hours | Worked hours are based on actual time worked, as recorded via punch-in/out data.
|
Absence Hours | Absence hours represent time linked to approved absences, calculated independently of scheduled shifts.
|
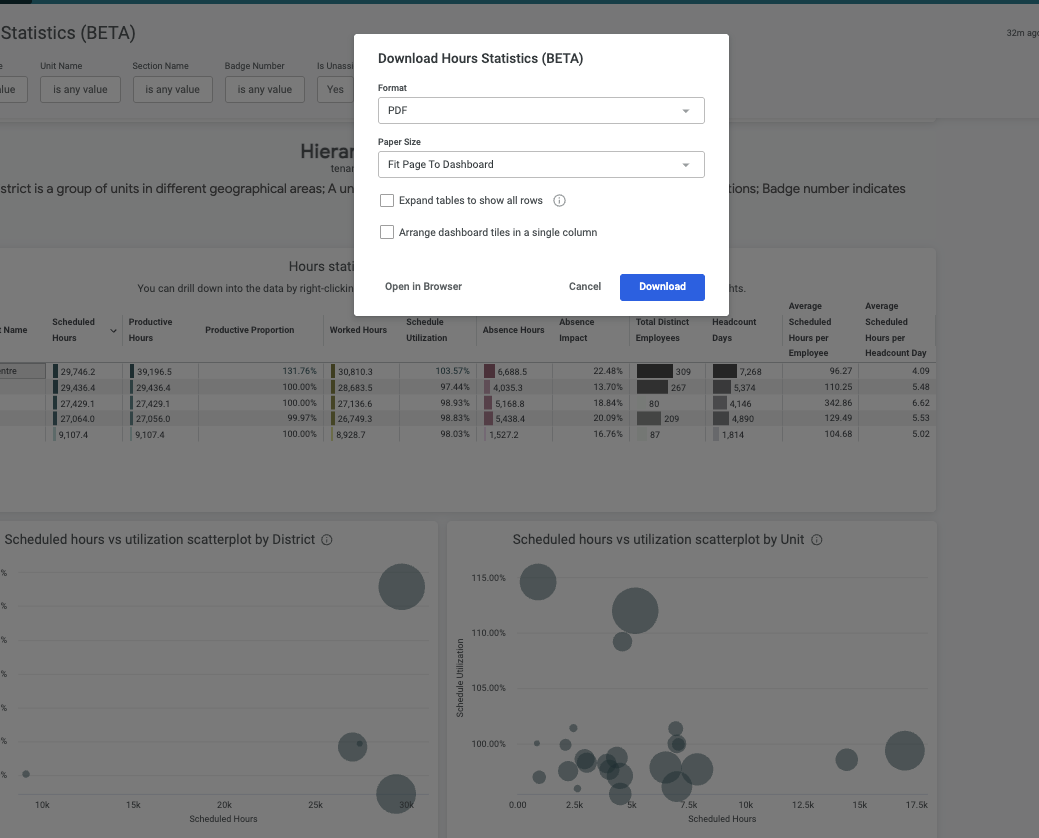
Beyond that, you can expect the same standard functionality as our other Advanced Analytics dashboards! With the same daily refresh, dynamic filtering, exports, and alerting functionality as defined in detail here.