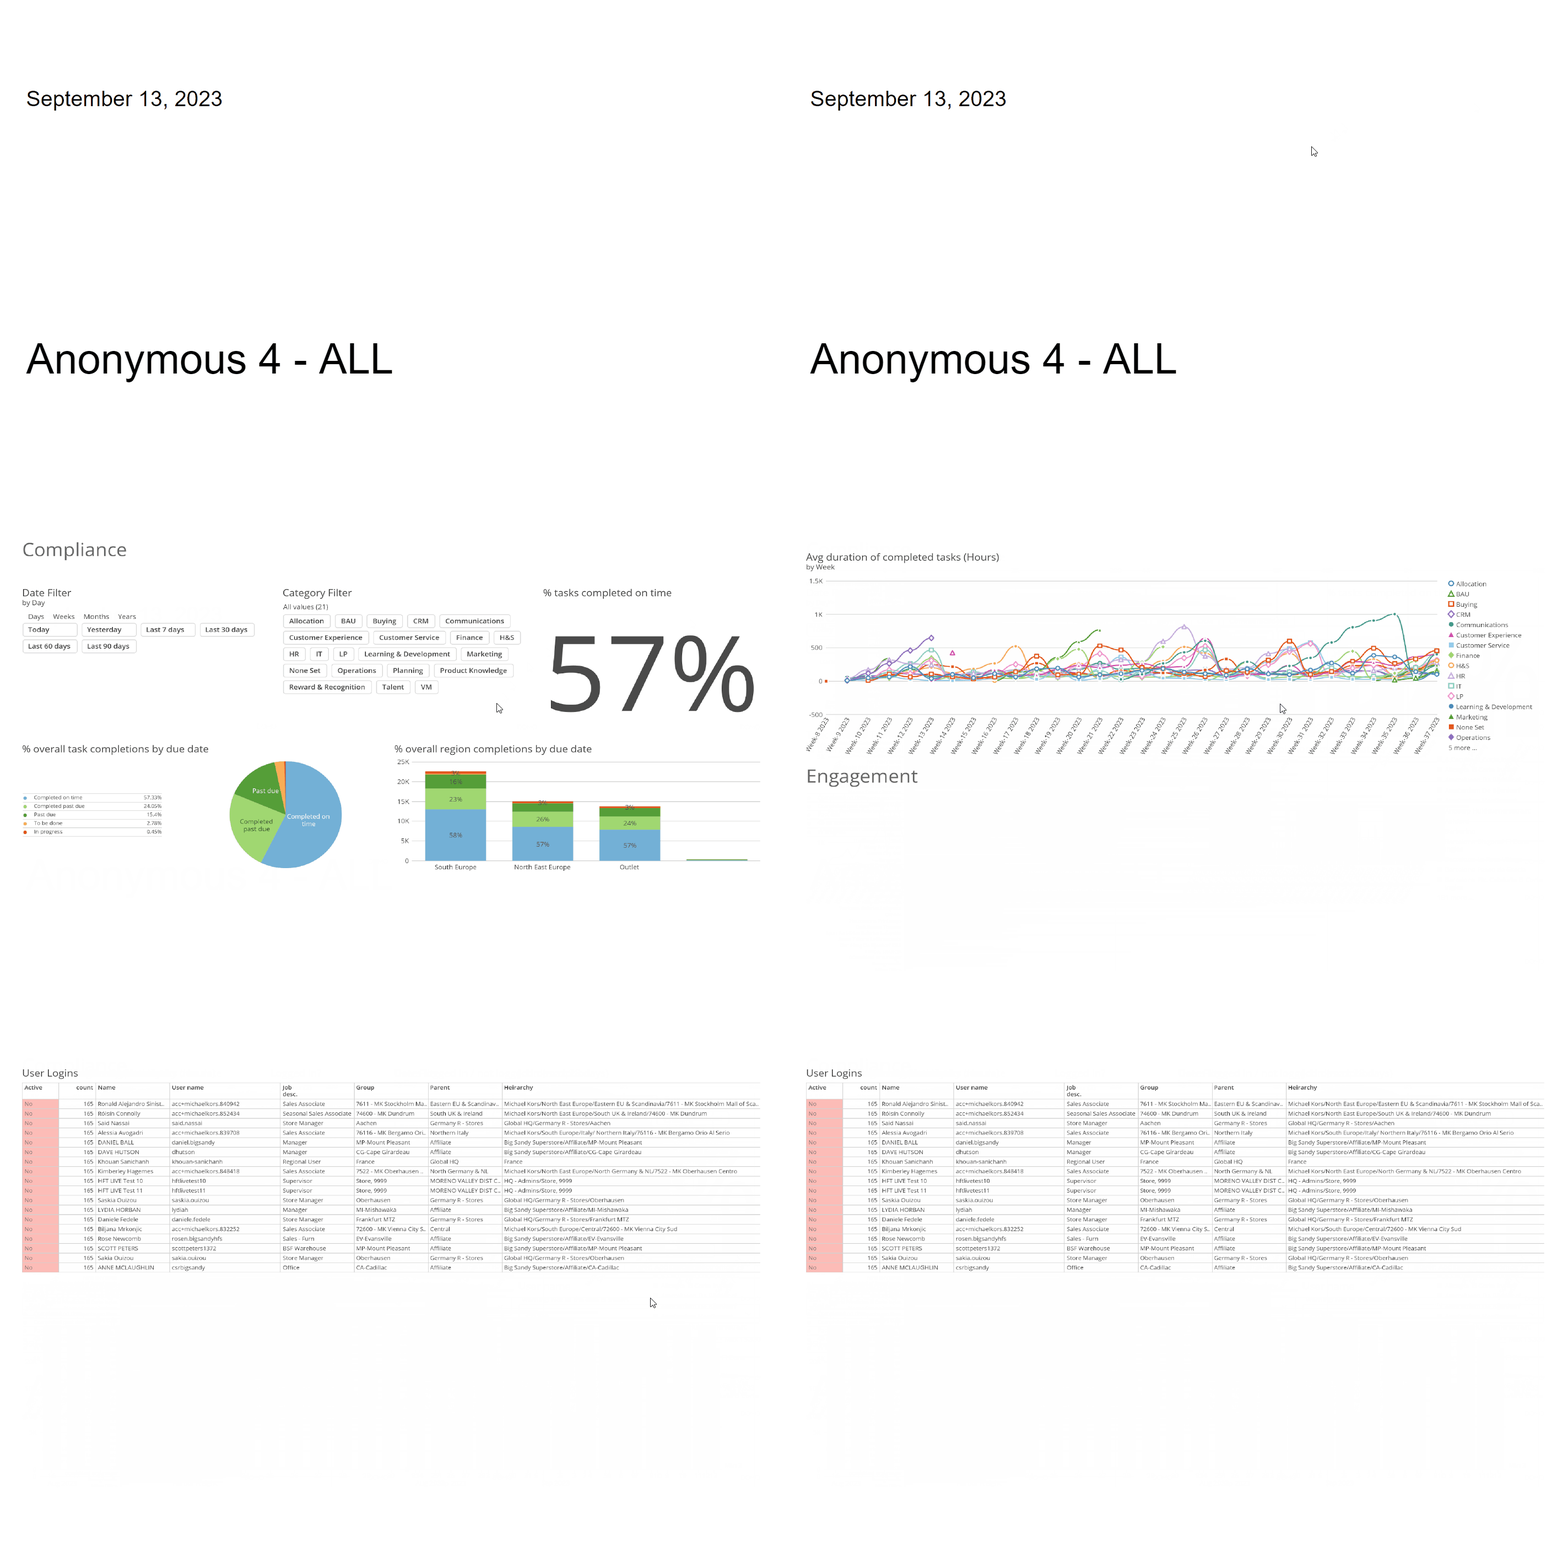
Employee Hub - Engagement reports
In the Employee Hub, you can get an overview of the compliance and engagement of your workforce with the Reports functionality. Reports are split into Compliance and Engagement. This article deals with the Engagement report functionality.
Engagement
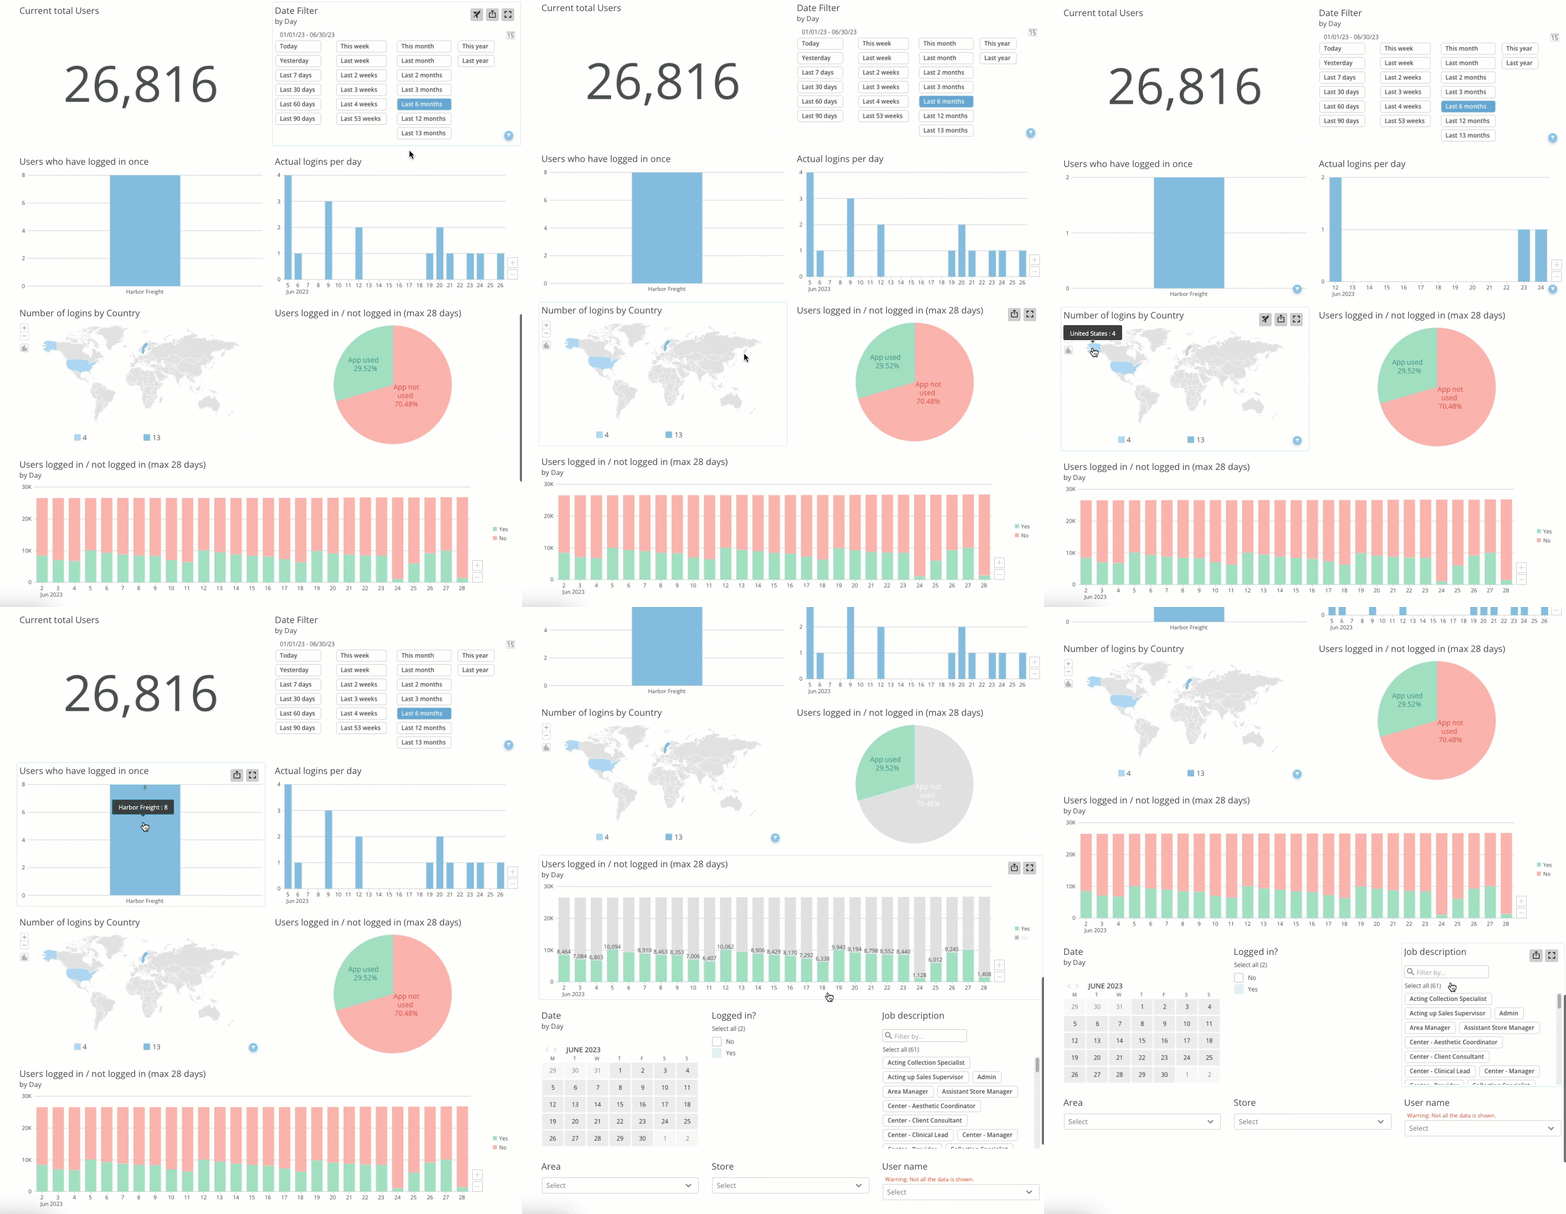
With the Engagement report functionality, your group can get visualized metrics on how well your workforce is engaging with the platform. You have several filtering options to drill down on a granular level and can track engagement throughout your organization based on actual logins per day, no. of logins per country, whether your users have logged in/not logged in, and much more. In addition, you can combine different filters to get specific data.
Filtering
Current total users
With the Engagement reports functionality you are able to see the current total amount of active users in your organization.
Date filter
With the Date Filter, you can select the relevant date span for your reports to show you information on. You have several options when filtering on dates.
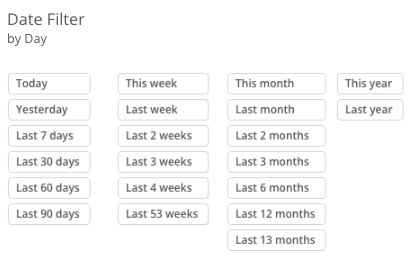
You can click the calendar icon to swap the data filter for a calendar filter.

Actual logins per day
You can see the actual logins per day in the app. By default, it will display 28 days.

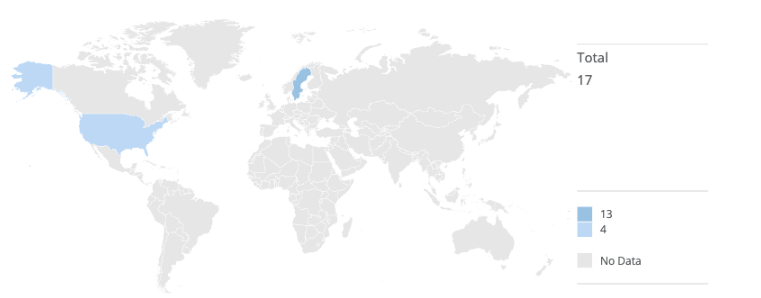
Number of logins of Country
With Number of logins by Country you can get insights on which countries across your organization engage the most with the platform. If a country is grey there is no data. With more logins, the country will be colored blue, where a darker shade indicates more activity.
Users logged in / not logged in (max 28 days)
With this functionality, you are able to visualize how much usage the platform has gotten over a maximum of 28 days. Of course, you can also select a smaller date span if you wish.

Downloading reports
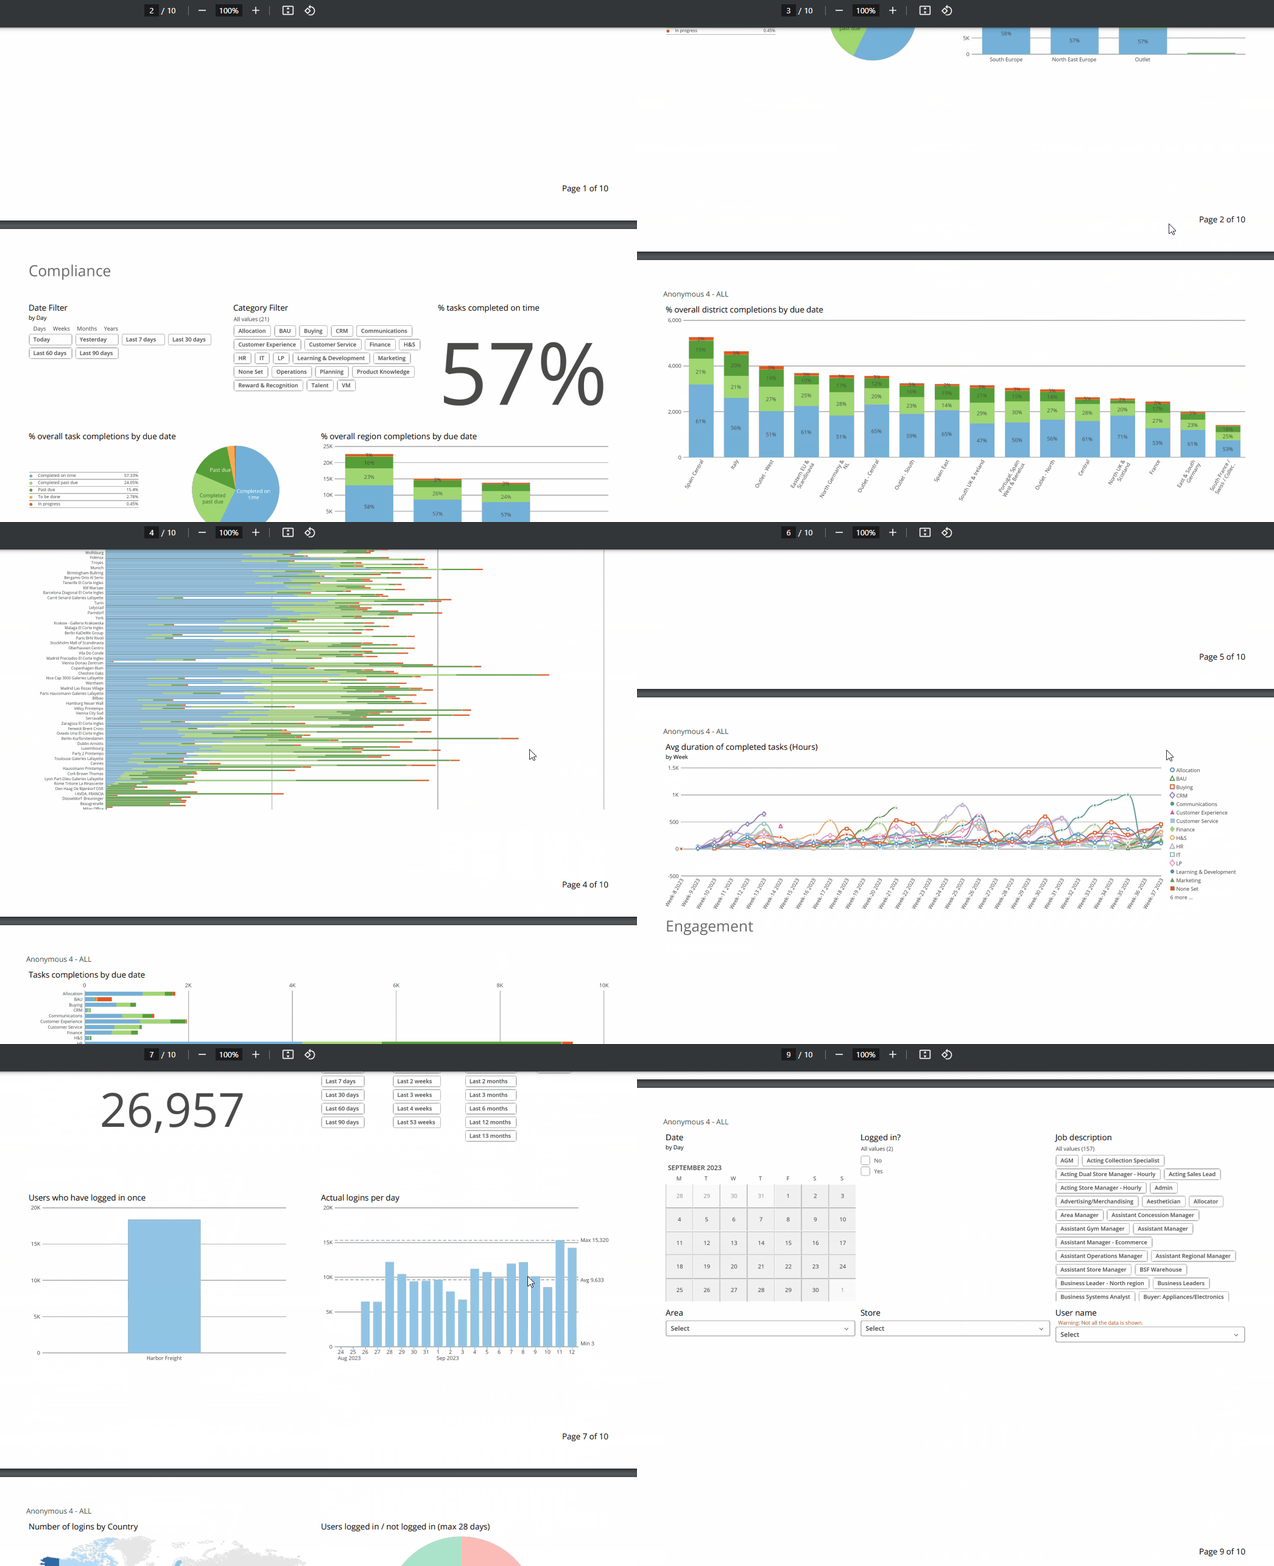
You can easily download your reports in PowerPoint or PDF format.

All Frontline Portal customers using the Reports module can download reports.
PowerPoint report
