Employee Hub - Compliance reports
 Updated
by
Daniel Sjögren
Updated
by
Daniel Sjögren
In the Employee Hub, you can get an overview of the compliance and engagement of your workforce with the Reports functionality. Reports are split into Compliance and Engagement. This article deals with the Compliance report functionality.
Compliance
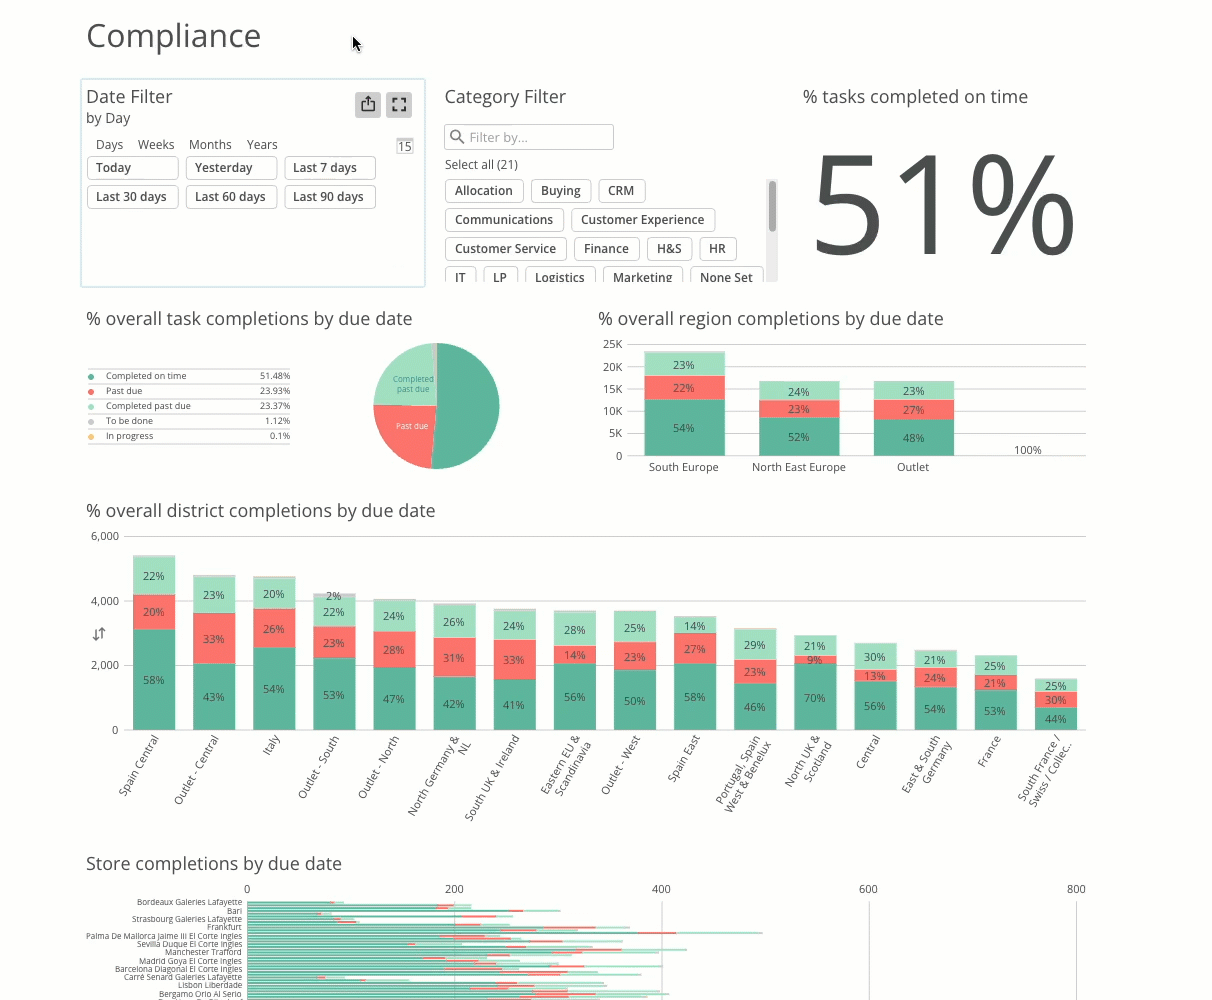
With the Compliance report functionality, your group can get visualized metrics on how well your workforce is complying with the tasks sent out to them. You have several filtering options to drill down on a granular level and can track compliance throughout your organization on region, district, store level, and much more. In addition, you can combine different filters to get specific data.
Filtering
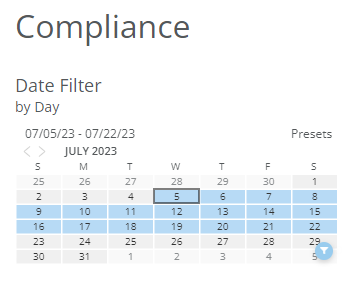
Date Filter
With the Date Filter, you can select the relevant date span for your reports to show you certain information. By default, the date span will be half a year back in time from today's date (180 days). However, you can also filter on the following date spans:
- Today: Displays data for today's date.
- Yesterday: Displays data from yesterday.
- Last 7 days: Displays data a week back (7 days) starting from today's date.
- Last 30 days: Displays data 30 days back starting from today's date.
- Last 60 days: Displays data 60 days back starting from today's date.
- Last 90 days: Displays data 90 days back starting from today's date.
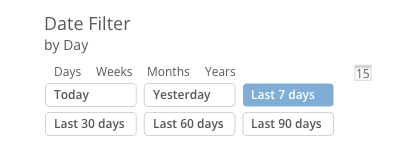
By selecting a different date filter, the data shown will dynamically update.
You can click the calendar icon to swap the data filter for a calendar filter that has the usual functionality that calendars have.
Category Filter
With the Category Filter, you can get data on different areas of your organization. Categories are like master tags. You could, for instance, have a category for each department in your organization like Customer Experience, HR, Operations, etc. However, you could equally have other categories set up to track planning, allocation, buying, and more.
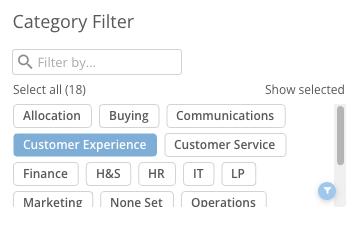
By selecting one or more categories, the Reports page will update to show you data on your selection.
Completions by due date
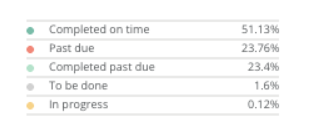
The idea with the compliance data is to show you or your group that has access to Reports the level of compliance by task completion by various metrics. Currently, you can track the level of completion based on the following:
- Completed on time: If a task or several tasks within your organization has been completed on time, they will be populated in the different charts as green.
- Past due: If a task or several tasks within your organization hasn't been completed and is past its due date, they will be populated in the different charts as red.
- Completed past due: If a task or several tasks within your organization has been completed past the set due date, they will be populated in the different charts as light green.
- To be done: If a task or several tasks within your organization has been created, but hasn't been started yet, they will be populated in the different charts as grey.
- In progress: If a task or several tasks within your organization is in progress, they will be populated in the different charts as yellow.
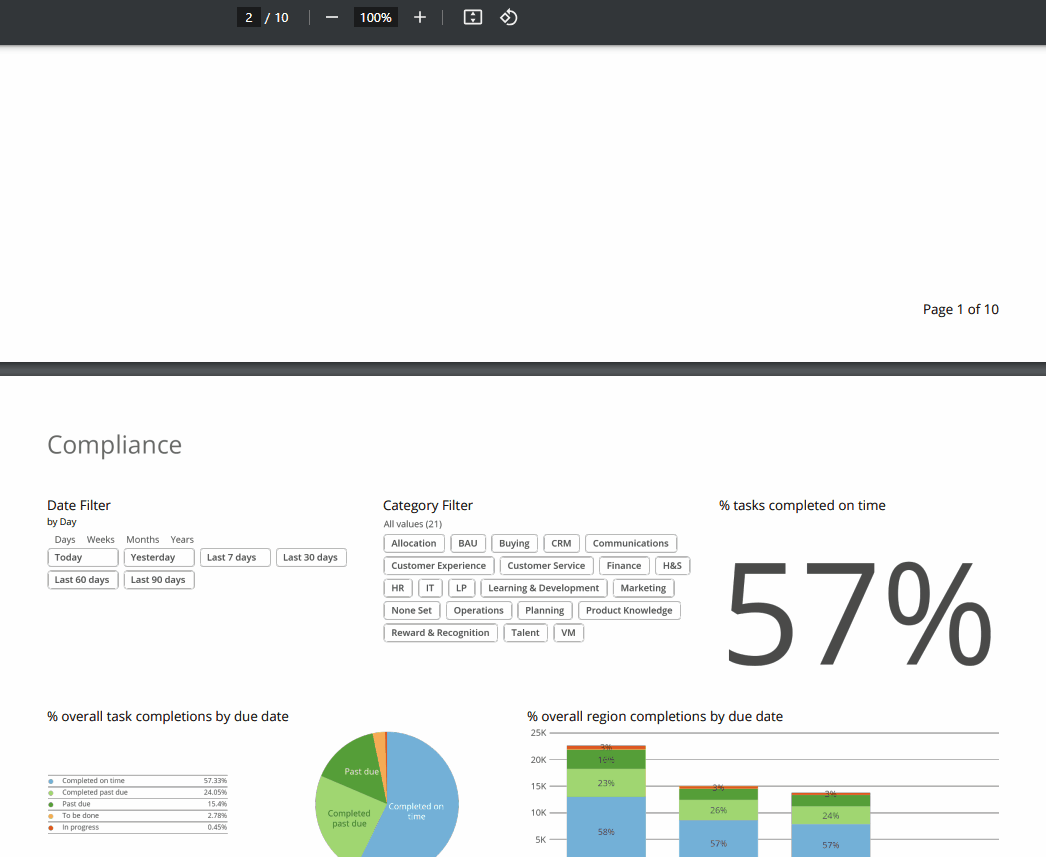
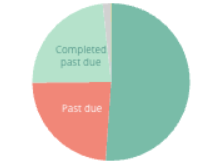
Overall completions by due date
Overall task completions by due date
This will show you the percentage of overall task completions across your organization. You will see the pie chart populated based on the above-mentioned completion categories.
Region completions by due date
This will show you the percentage of overall task completion based on the regions in your organization. F.ex. your organization might have South Europe being one region, while another could be North East Europe.
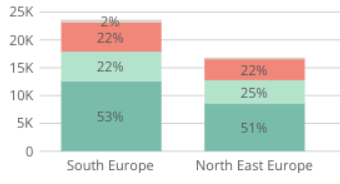
Tip! Simply click on the column label in the bar chart to select individual Regions.
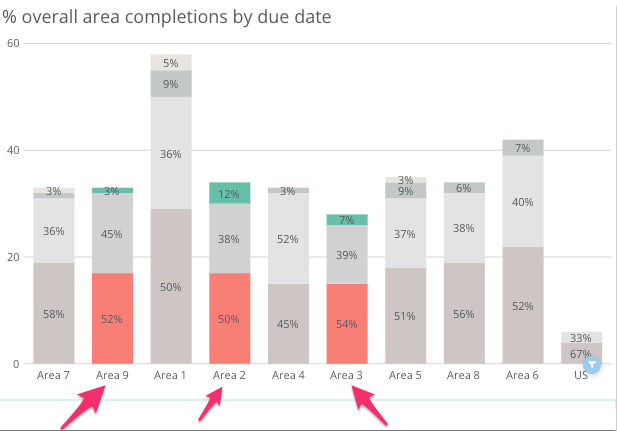
District completions by due date
This will show you the percentage of overall task completion by due date based on the districts of your organization. Districts are one step more granular than regions and could be anything from different areas of a specific country to several countries. For instance, your organization might have Italy being one district, while another could be South UK & Ireland.
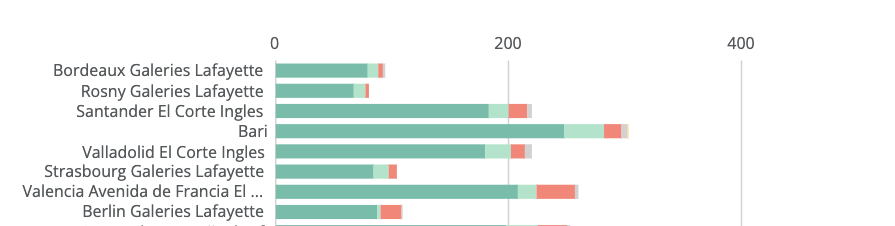
Store completions by due date
This will show you the percentage of overall task completions by due date based on the stores of your organization.
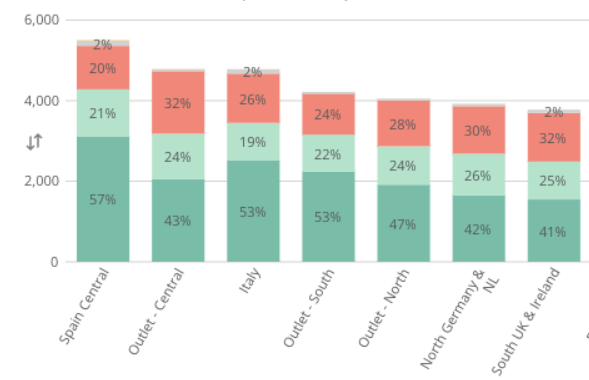
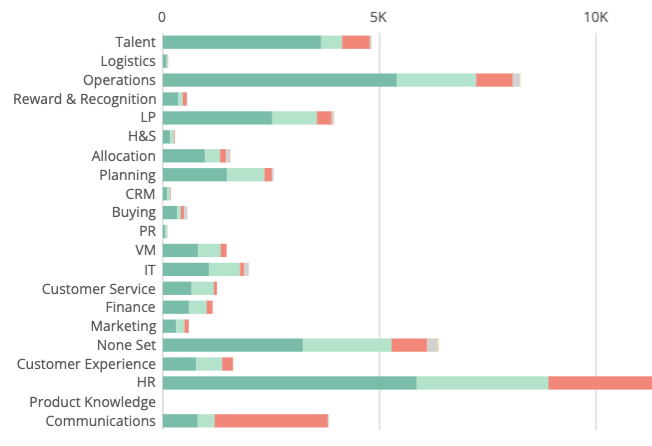
Category task completions by due date
Just like with geographical locations such as regions, districts, or stores, you can get data on the overall task completions by due date based on the categories you have set up across your organization. For instance, you might want to see how your Finance or Customer Service departments are doing in terms of completing tasks within your organization.
Task volume loads and duration
The number of tasks of an organization will ebb and flow over time. With the Compliance report functionality, you can identify task volume trends, track store task load by due date, or see the average duration of completed tasks based on the categories set up by our organization.
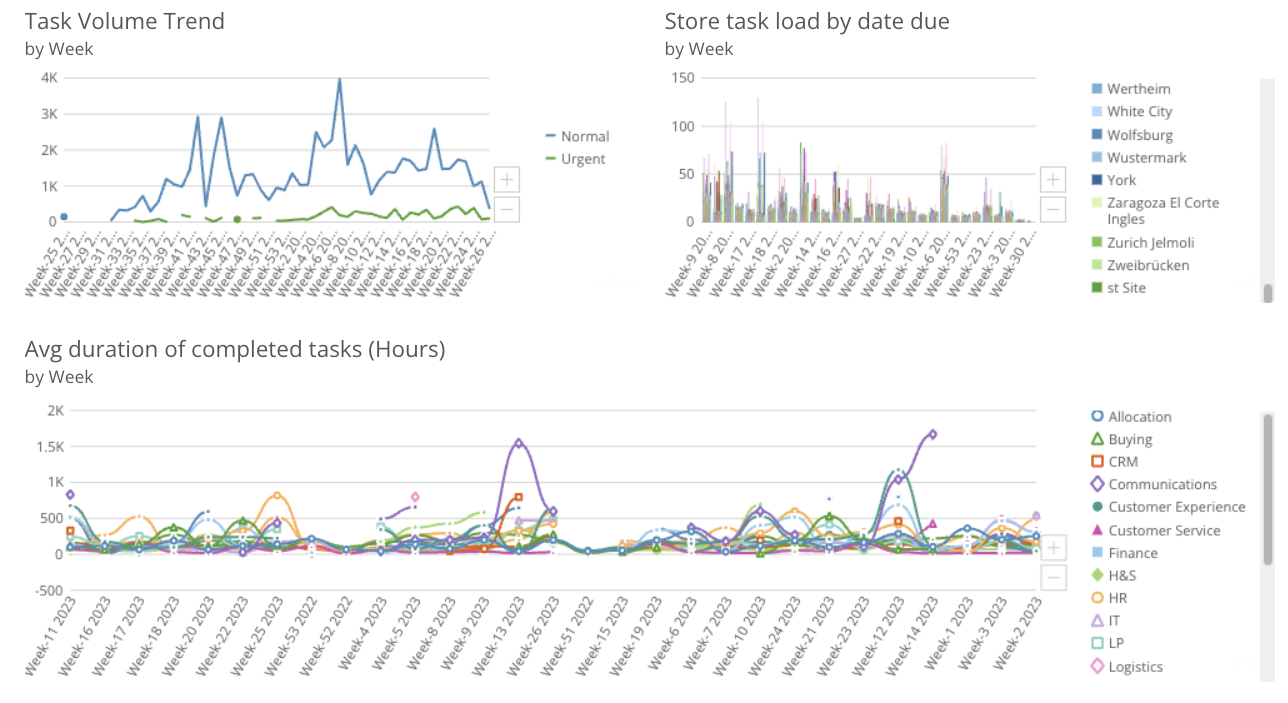
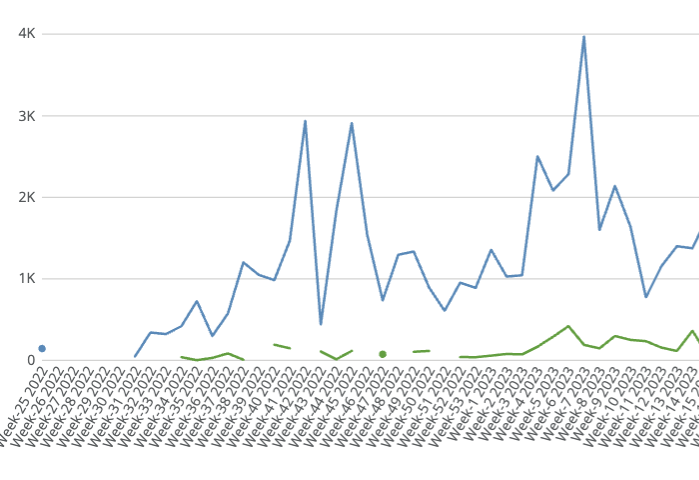
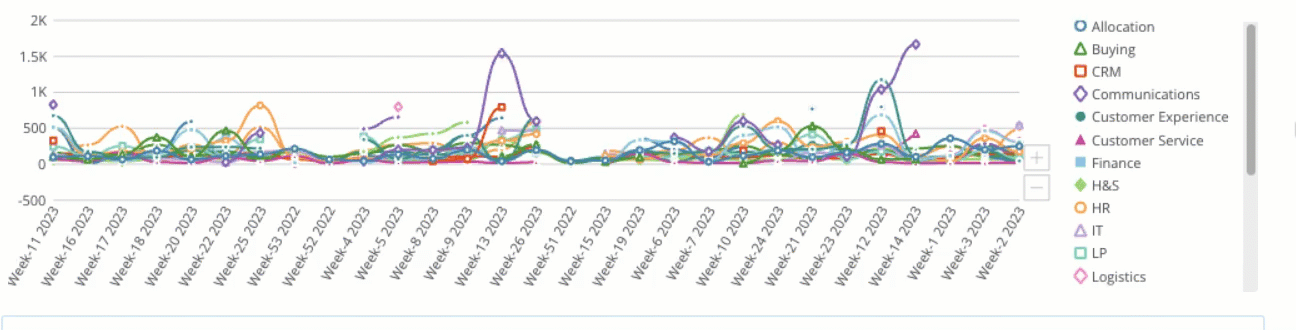
Task Volume Trend (by week)
With Task Volume Trend, you can get data on peak times when fewer or more tasks are being completed within your organization from week to week. This can be useful when trying to identify patterns or red threads. For example, is there something in particular, like an event that may be happening during a certain week?
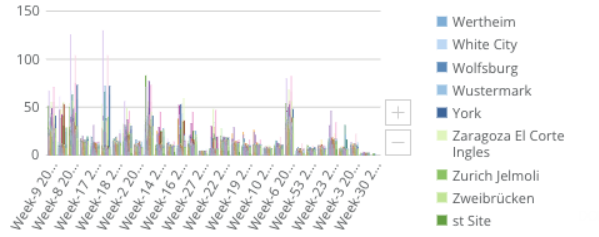
Store task load by due date (by week)
Track at what times your stores create fewer or more tasks on a weekly basis throughout your organization. This can be useful when trying to understand different markets. For instance, is there a regional event taking place in a certain country or region of your business that might cause more tasks to be created during a specific week?
Average duration of completed tasks (hours) by week
Besides Task load or Task volume trends, you can also track the Average duration of completed tasks (h) on a weekly basis. With this, you can identify if certain areas/categories of your organization are taking longer time to complete tasks than others and figure out why that might be.
Downloading reports
You can easily download your reports in PowerPoint or PDF format.
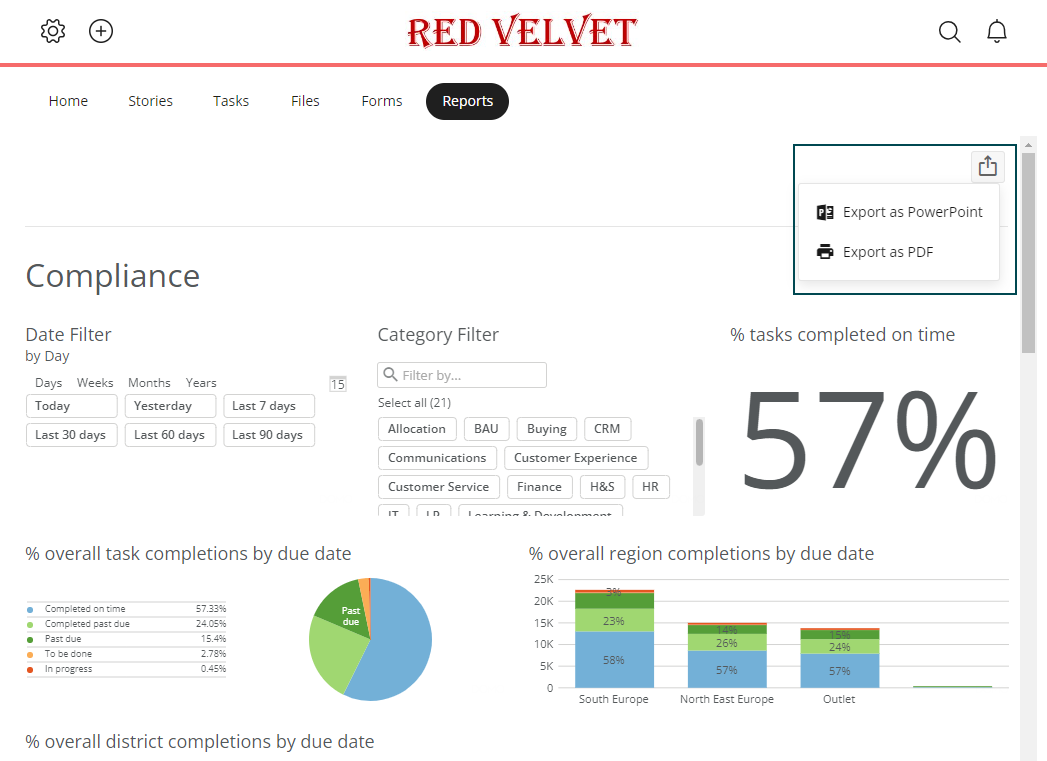
All Employee Hub customers using the Reports module can download reports.
PowerPoint report