Advance Analytics - Forecast dashboard
 Updated
by
Victor Jespersen
Updated
by
Victor Jespersen
The Forecast dashboard provides a detailed comparison between forecasted demand and actual demand, giving operational teams clear insight into forecast accuracy, variable-level performance, and predictive confidence ranges. It supports both historical forecast analysis and upcoming forecast projections, enabling data-driven staffing and planning decisions.
The dashboard is divided into two main modes:
- Historical forecast – Compare past forecasts versus actual performance
- Upcoming forecast – Review demand predictions with confidence ranges
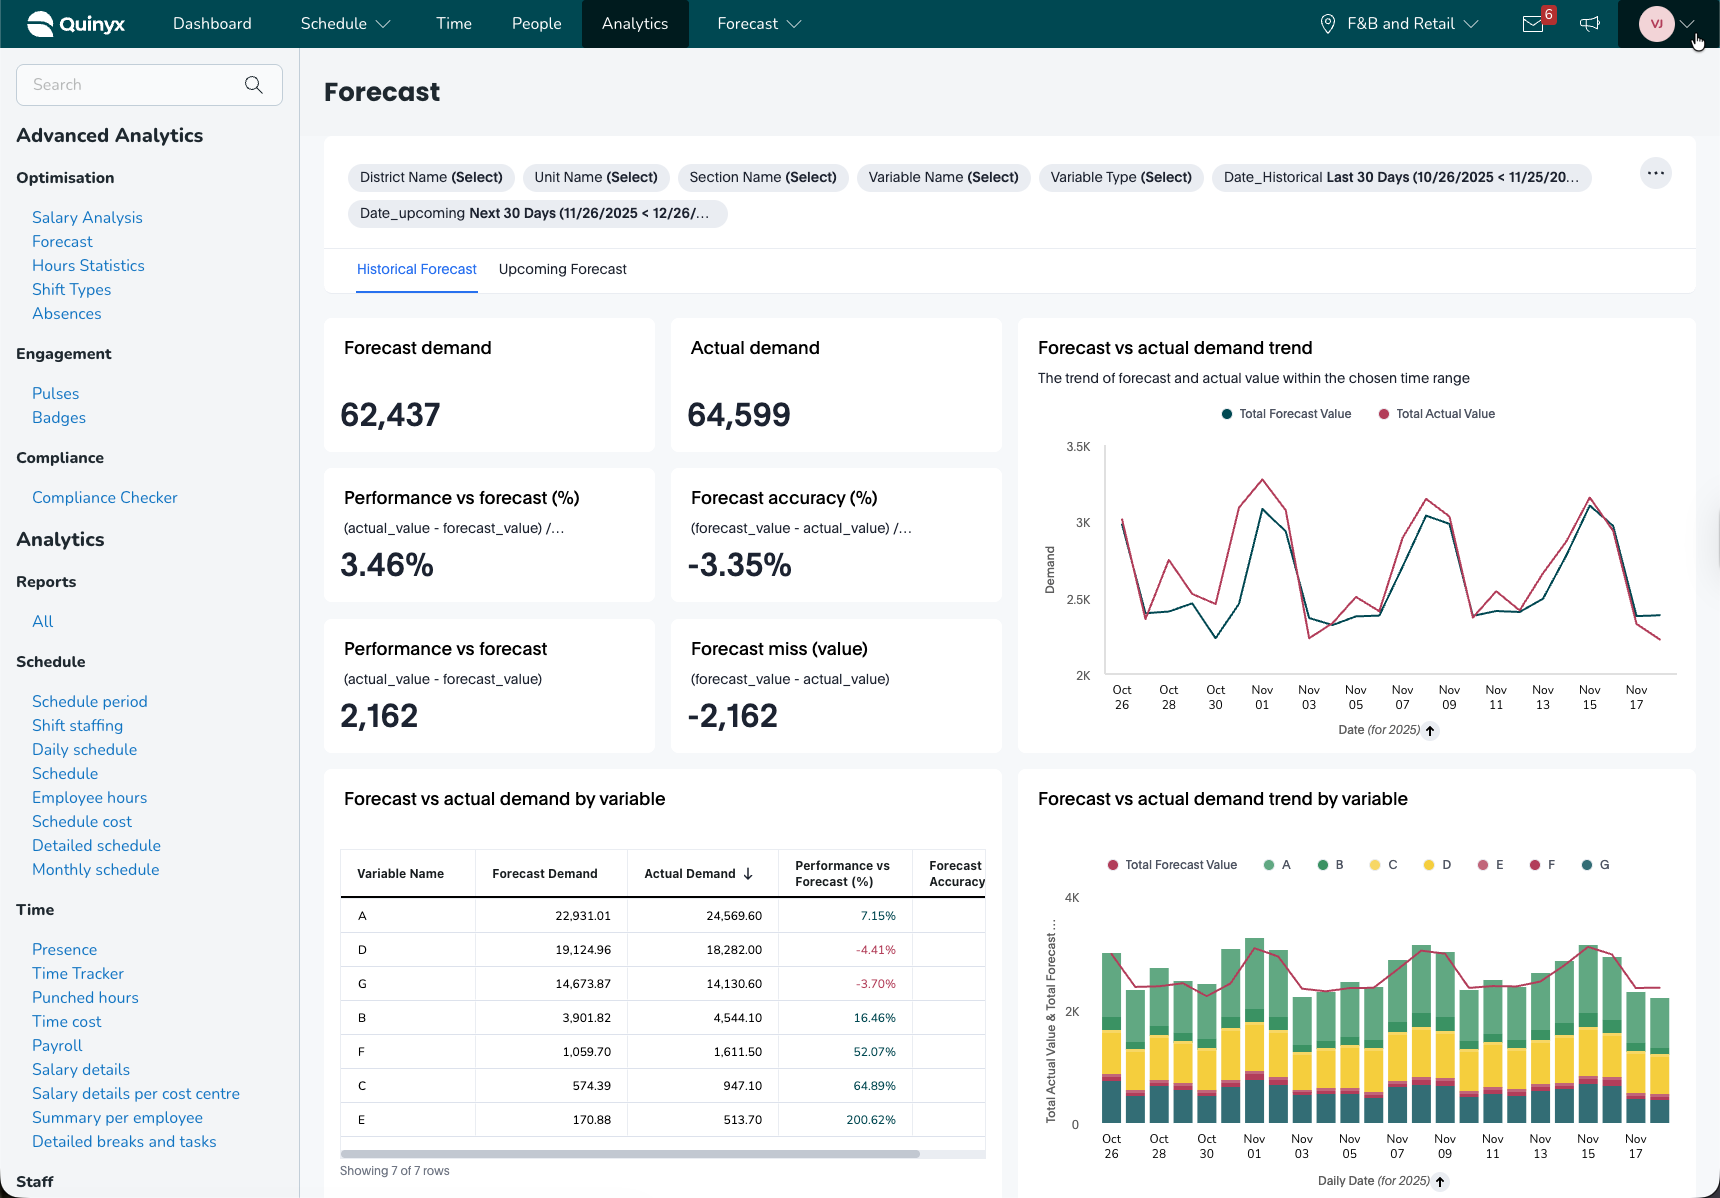
How it works
The Forecast dashboard contains two main sections, each with multiple components:
- Historical Forecast
- Forecast vs Actual performance
- Trends over time
- Breakdown by variables
- Hierarchy comparisons (district → unit → section)
- Upcoming Forecast
- Total forecast demand
- Confidence range (90% likelihood)
- Forecast by variable
- Forecast by hierarchy (district → unit → section)
Each section includes filters for District, Unit, Section, Variable, Variable Type, and custom date range selection.
Historical forecast tab

This view compares forecasted demand against realised demand for a selected historical period.
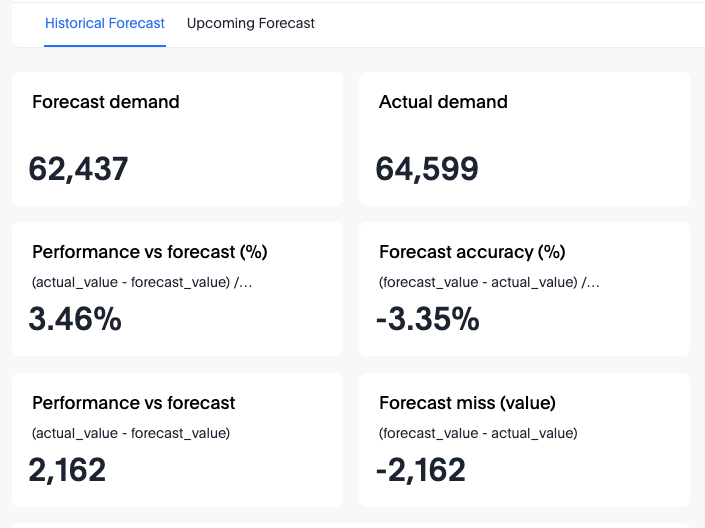
Top KPIs
The header cards provide quick insight into historical forecasting performance:
- Forecast demand – Expected demand during the selected period
- Actual demand – Real demand recorded
- Performance vs Forecast (%)
(actual − forecast) ÷ forecast
Positive = actual demand was higher - Forecast accuracy (%)
(forecast − actual) ÷ actual
Negative = forecast underestimated actuals - Performance vs Forecast (value)
Difference in absolute values - Forecast miss (value)
(forecast − actual)
These KPIs allow rapid identification of under- or over-forecasting trends.
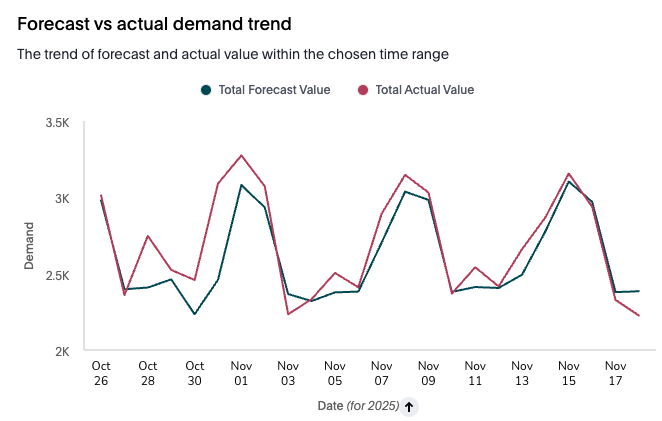
Forecast vs Actual demand trend
A time-series chart showing a daily comparison between forecast and actual demand.
Use this chart to:
- Identify days with significant deviation
- Spot recurring patterns or spikes
- Validate forecast model behaviour
Forecast vs Actual by variable
Each demand variable (A, B, C, D, E, F, G) is evaluated across:
Column | Purpose |
Forecast Demand | Total predicted demand for the variable |
Actual Demand | Total recorded demand |
Performance vs Forecast (%) | Accuracy deviation |
Forecast Accuracy | Additional accuracy indicator |
A colour-coded bar/stacked chart visualises variable contribution and deviation.

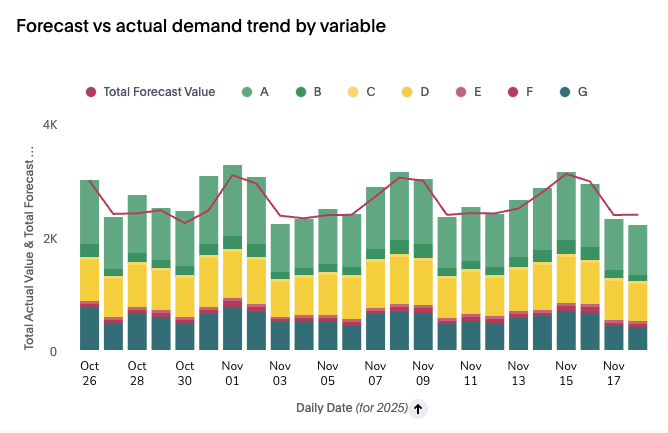
Forecast vs Actual demand by variable
A breakdown of forecast accuracy per variable.
Variable | Forecast vs Actual | Performance Notes |
Some variables exceed forecast | Positive % | Actual > forecast |
Others fall behind | Negative % | Forecast > actual |
A bar graph and line trend show how each variable contributes to total demand and how the actual values compare to the forecast across days.
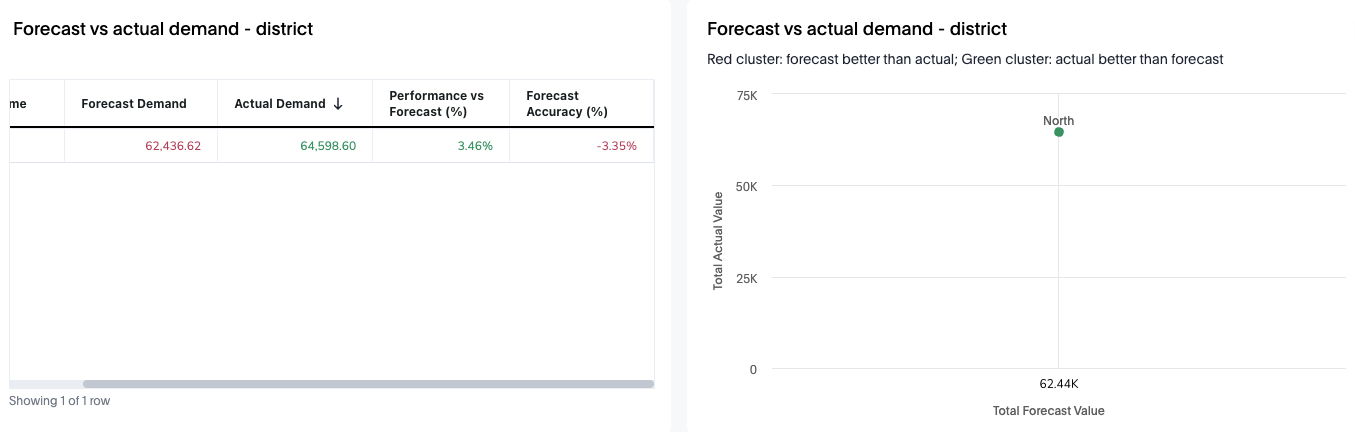
Forecast vs Actual demand – District
Table and scatter-plot showing:
- Forecast demand
- Actual demand
- Performance vs forecast (%)
- Forecast accuracy (%)
Each district appears as a plotted point where:
- Green = actual > forecast
- Red = forecast > actual
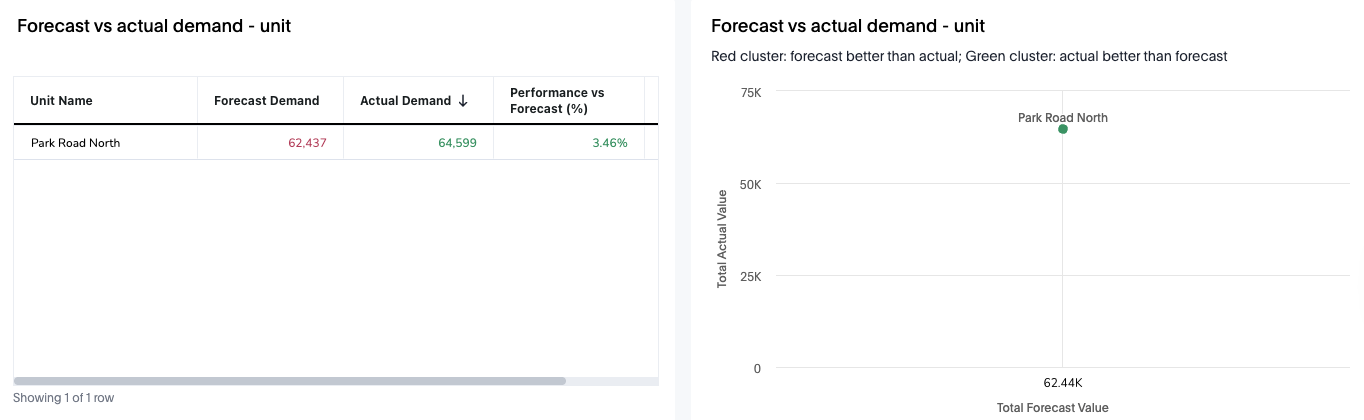
Forecast vs Actual demand – Unit
Same format, scoped to units inside the selected district.
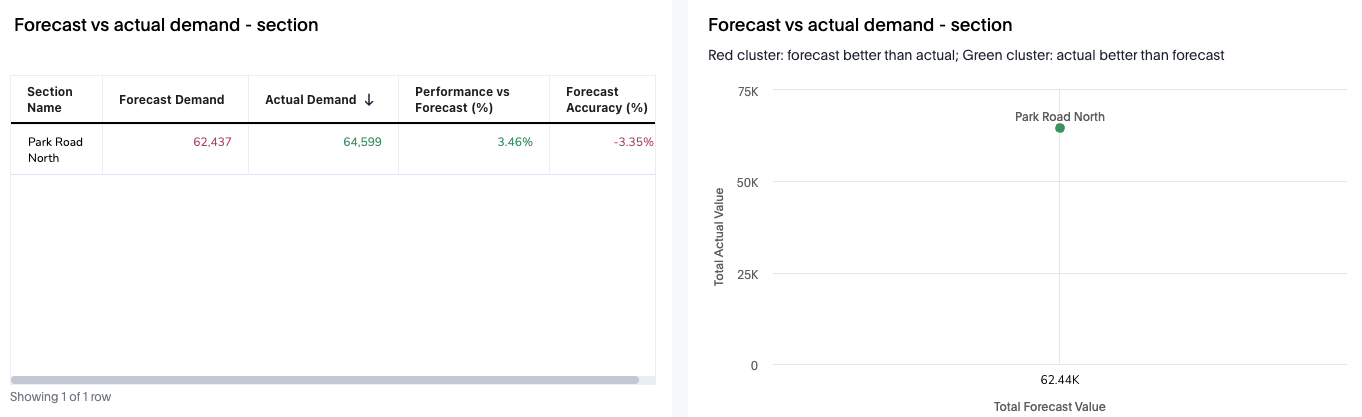
Forecast vs Actual demand – Section
Same format, scoped to units inside the selected district/ unit.
Upcoming forecast
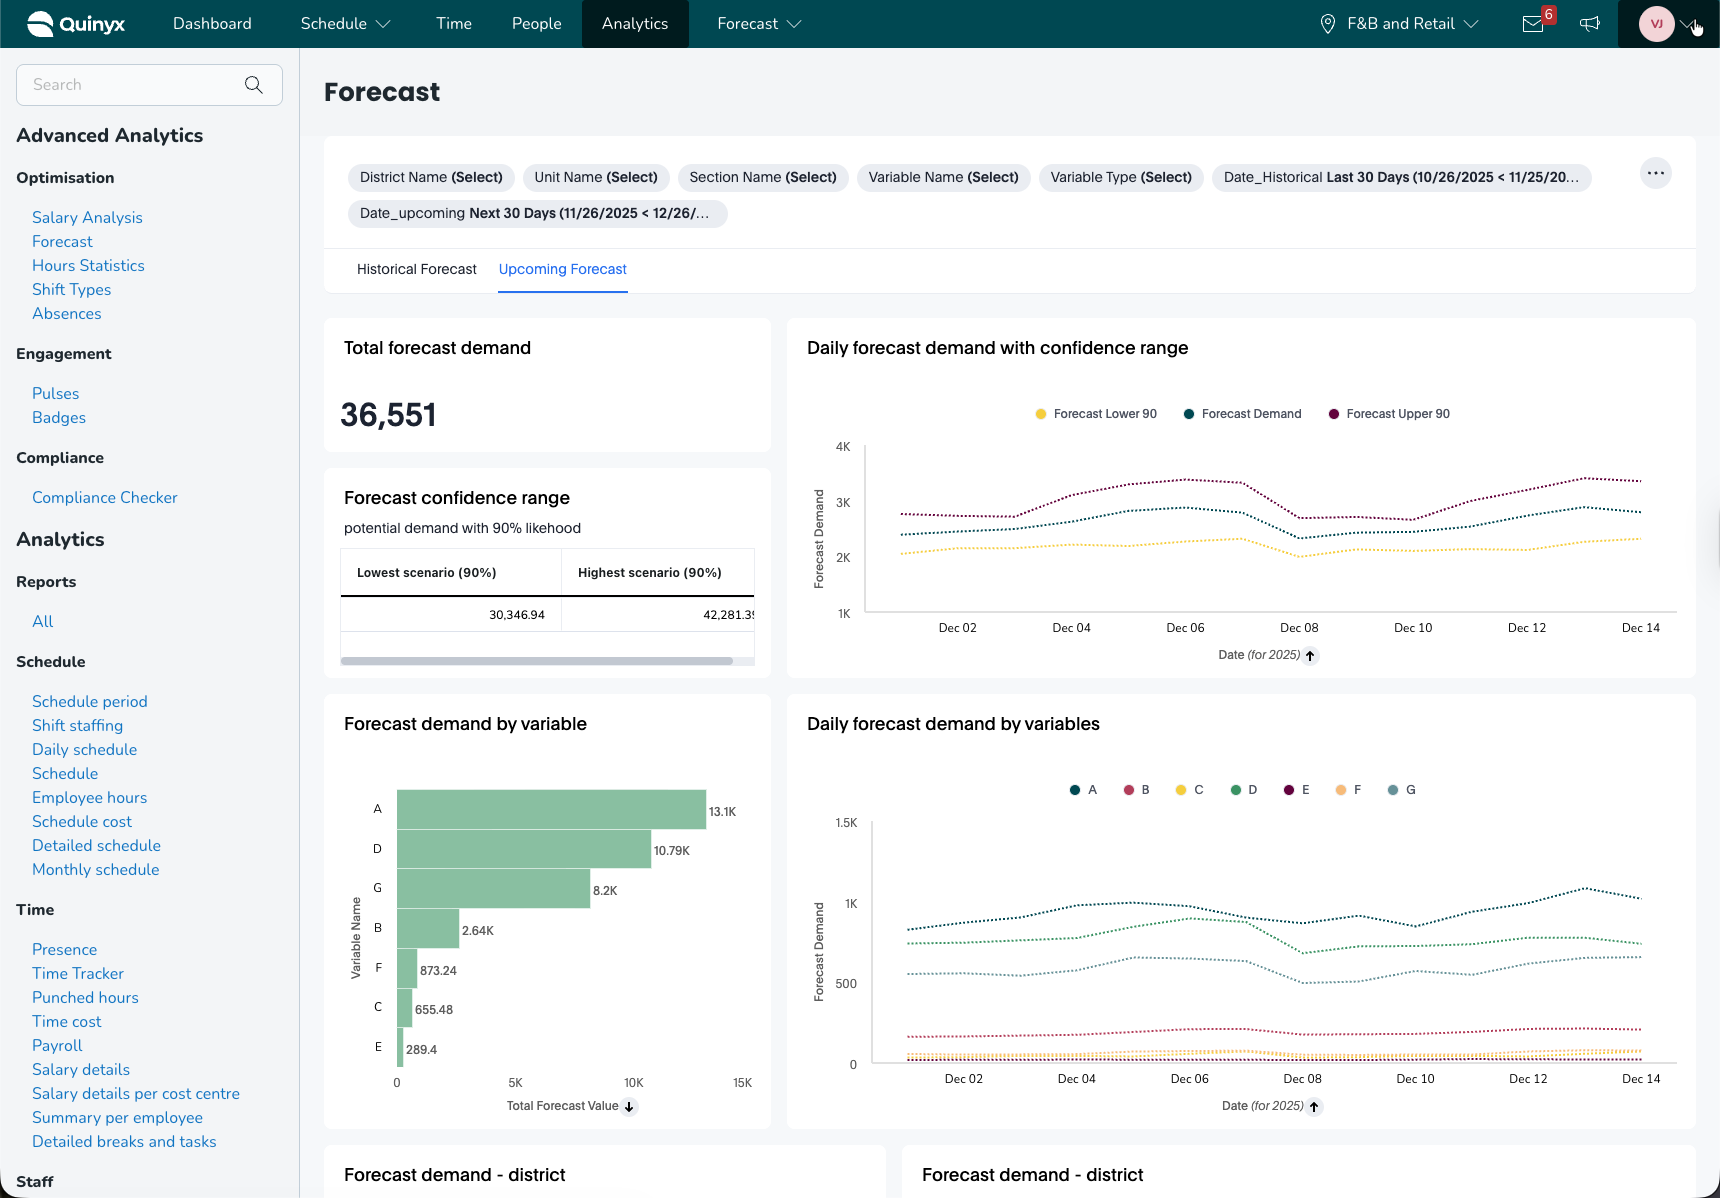
The Upcoming Forecast view predicts future demand and provides confidence intervals to support staffing and labour planning.
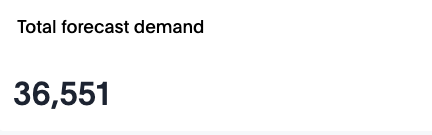
Total forecast demand
A single KPI expressing the total forecast demand for the upcoming period.
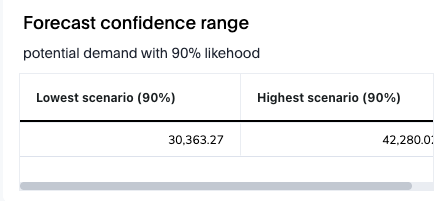
Forecast confidence range
A table showing upper and lower bounds for predicted demand:
- Lowest scenario (90%)
- Highest scenario (90%)
This indicates a 90% likelihood that real demand will fall within the given range.
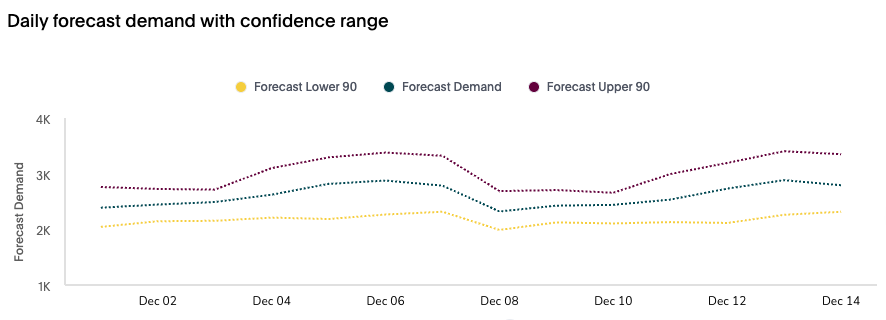
Daily forecast demand with confidence range
Three lines illustrate:
- Forecast Lower 90
- Forecast Demand
- Forecast Upper 90
Use this for:
- Anticipating variability
- Risk-based staffing decisions
- Identifying high-uncertainty days
Forecast demand by variable
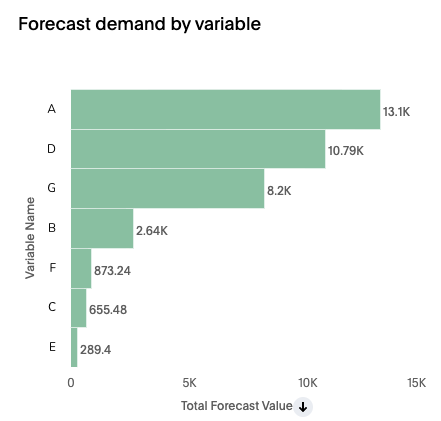
A horizontal bar chart ranking variables by forecasted contribution. This helps identify demand drivers for the selected period.
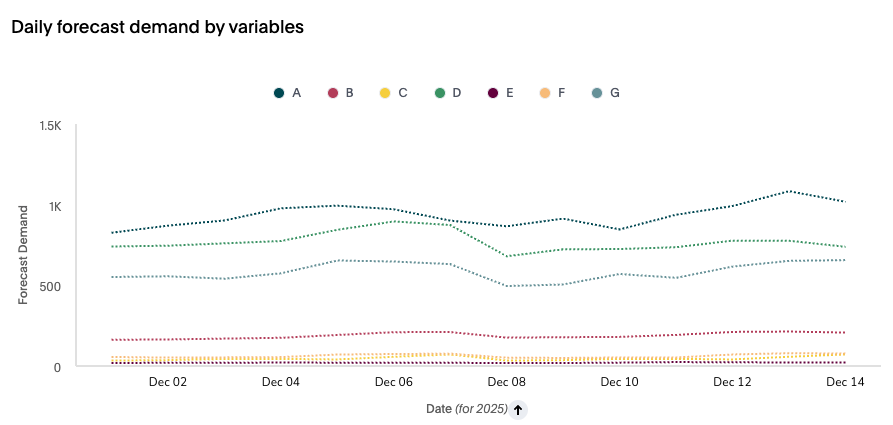
Daily forecast demand by variables
A multi-line trend showing forecasted demand per variable over time.
Ideal for:
- Monitoring expected workload drivers
- Understanding which variables cause peaks
- Planning role-specific staffing
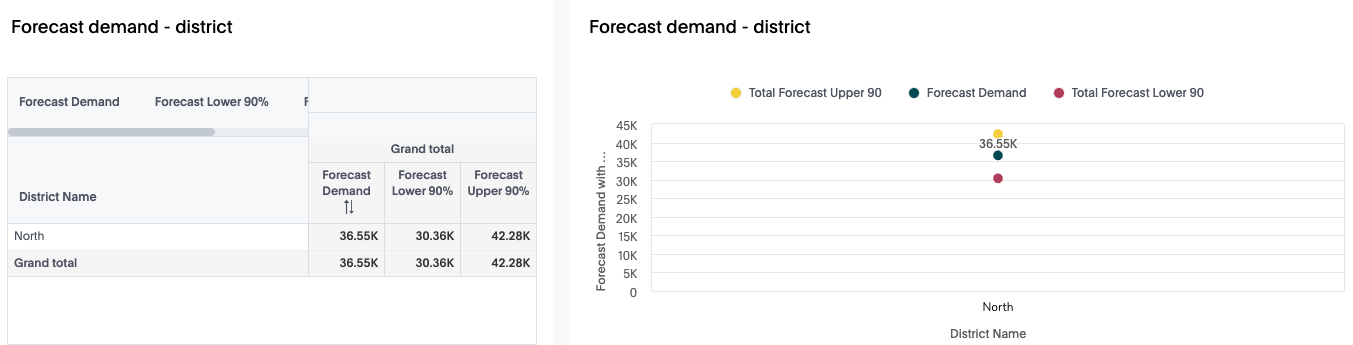
Forecast Demand – District
Includes:
- Forecast demand
- Lower 90% bound
- Upper 90% bound
Plus a graph plotting these values by district.
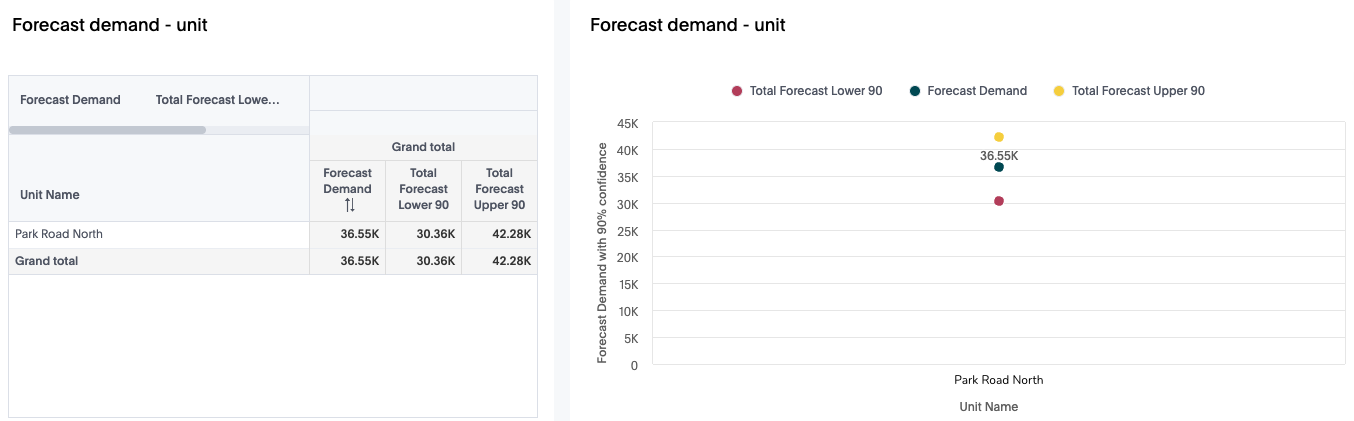
Forecast Demand – Unit
Same values plotted for specific units (e.g., Park Road North).
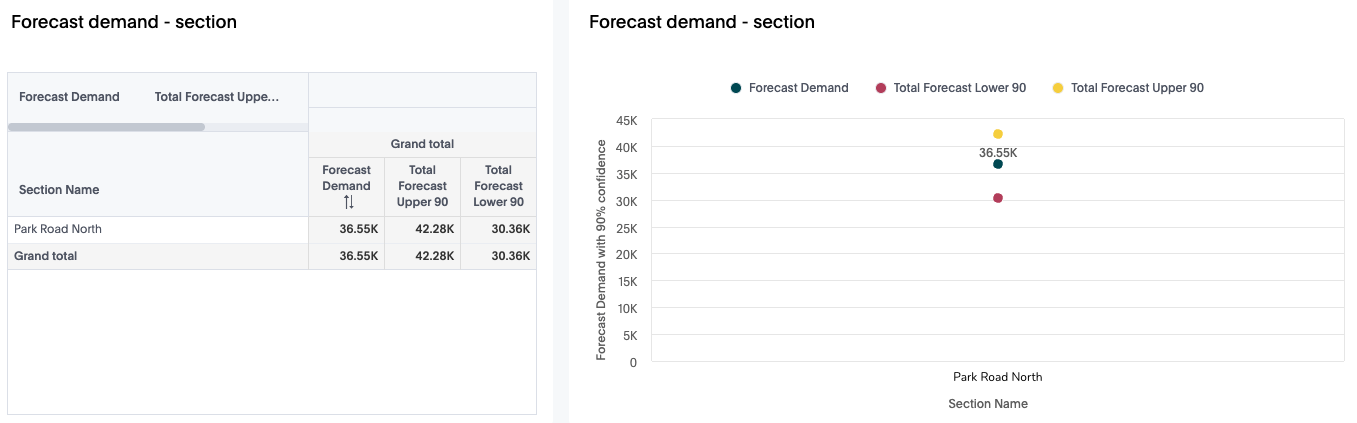
Forecast Demand – Section
Breakdown at section level within units.
These comparisons support:t
- Demand planning by region
- Load balancing across the organisation
- Staffing allocation before schedule creation
Practical Use Cases
1. Measure Forecast Accuracy for Workforce Planning
Use Historical Forecast to validate whether over- or under-staffing occurred.
2. Identify Demand Drivers
Variable-level charts reveal which operational factors contribute most to demand.
3. Anticipate High- and Low-Demand Days
Confidence interval charts help plan staffing buffers and risk contingencies.
4. Regional or Store-Level Planning
Hierarchy views show which districts, units, or sections consistently overperform or underperform against the forecast.
5. Improve Predictive Modelling
Performance metrics help analysts refine variable selection and model weighting.
6. Communicate Trends to Stakeholders
Export visual charts and tables to share insights with management or schedule planners.
Conclusion
The Forecast Dashboard provides a comprehensive view of both historical performance and upcoming demand. With insights across variables, time trends, and organisational hierarchy, it empowers teams to optimise labour planning, increase forecast accuracy, and make informed operational decisions.