Advanced Analytics - Absences dashboard
 Updated
by
Daniel Sjögren
Updated
by
Daniel Sjögren
Introduction
The Absences Dashboard provides a complete overview of employee absence patterns across your organization. It allows you to track total absence hours, understand absence types and reasons, explore trends over time, and drill down into detailed information at unit, section, or employee level.
This dashboard is designed for managers, HR partners, and operational leaders who need clear visibility into absenteeism to support workforce planning, staffing decisions, and policy improvement.

How it works
The Absences Dashboard contains three core analytical views:
- Overview – High-level metrics and absence trends
- Hierarchy View – Breakdowns by organizational layers
- Employee Details – Absence data per employee
Each section supports filtering, exporting, and deeper drill-down for detailed insights.
Overview Tab

The Overview tab provides a snapshot of overall absence activity within the selected timeframe.
Headline Metrics
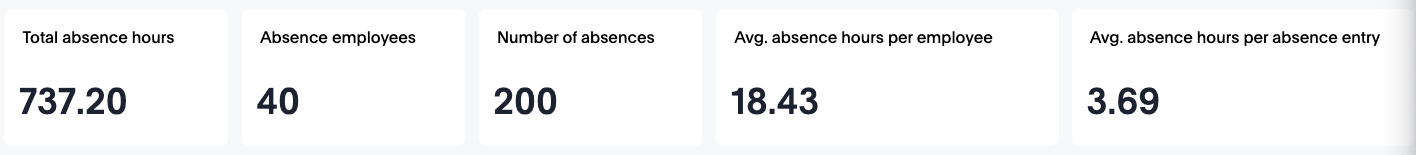
Included at the top of the dashboard:
- Total absence hours
- Absence employees (unique employees with at least one absence)
- Number of absences
- Avg. absence hours per employee
- Avg. absence hours per absence entry
These metrics help you quickly assess the scale and distribution of absence events across your workforce.
Absence Hours Over Time
This chart visualizes overall absence behaviour across the selected period. It includes:
- Total Absence Hours (line)
- Unique Employees (columns)
You can spot peaks, recurring patterns, or quiet periods.
Absence Hours by Leave Type
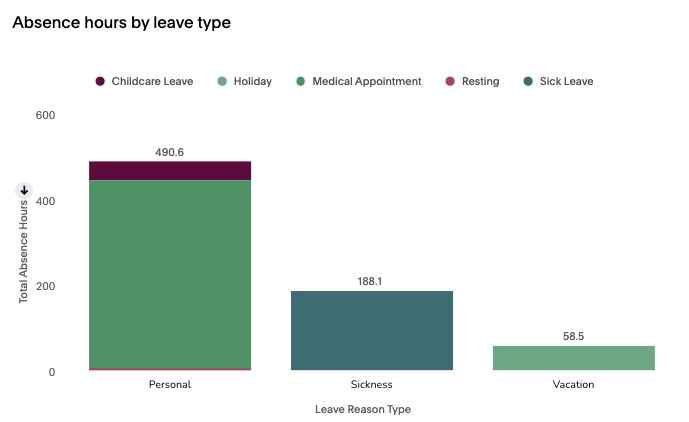
A grouped bar chart showing total absence hours grouped under broad leave types such as:
- Personal
- Sickness
- Vacation
Helpful for seeing which types contribute most to total absence time.
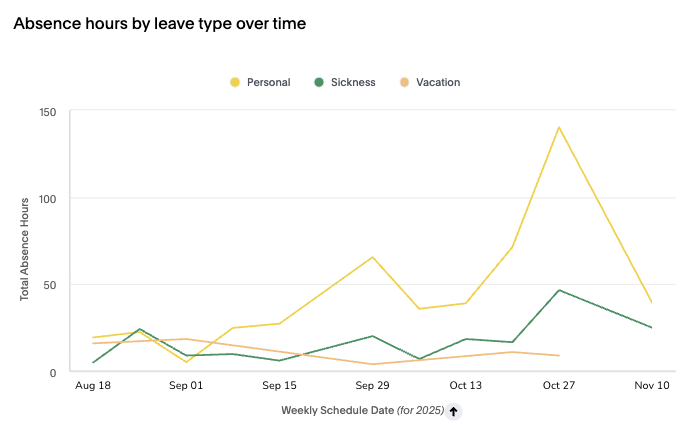
Absence Hours by Leave Type Over Time
Shows trends in the three major leave categories over the selected time period.
Absence by Leave Reason
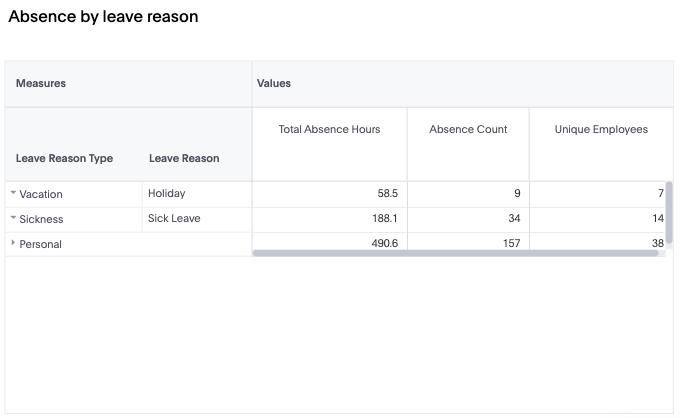
A detailed table that breaks down:
- Total Absence Hours
- Absence Count
- Unique Employees
- Leave Reason Type → Leave Reason
This table reveals exactly which reasons (e.g., Sick Leave, Holiday) drive absence hours.
Absence Hours by Leave Reason Over Time

A time-series trend of detailed reasons such as:
- Childcare Leave
- Holiday
- Medical Appointment
- Resting
- Sick Leave
Hierarchy View Tab
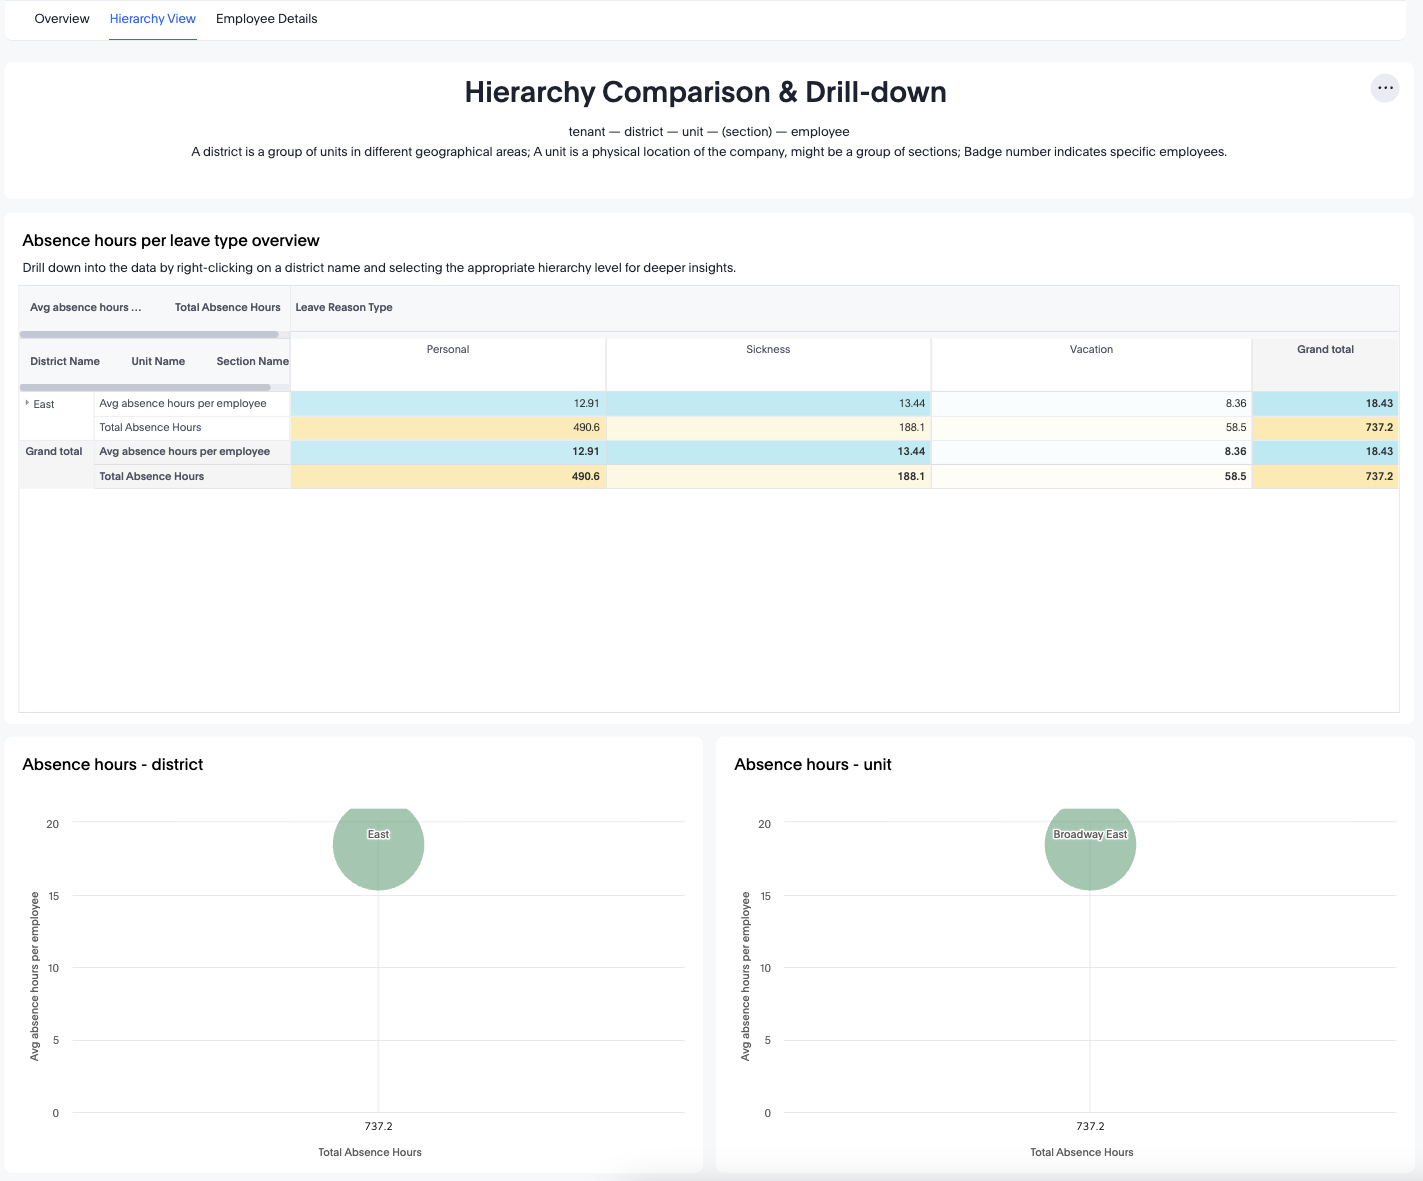
The Hierarchy View allows you to analyze absences by organizational structure:
Tenant → District → Unit → (Section) → Employee
Absence Hours per Leave Type Overview
This summary table shows:
- Avg. absence hours per employee
- Total absence hours
- Leave Reason Type (Personal, Sickness, Vacation)
Values can be grouped by:
- District
- Unit
- Section
You can right-click to drill further into any hierarchy level.
Bubble Charts: Absence Hours by Level
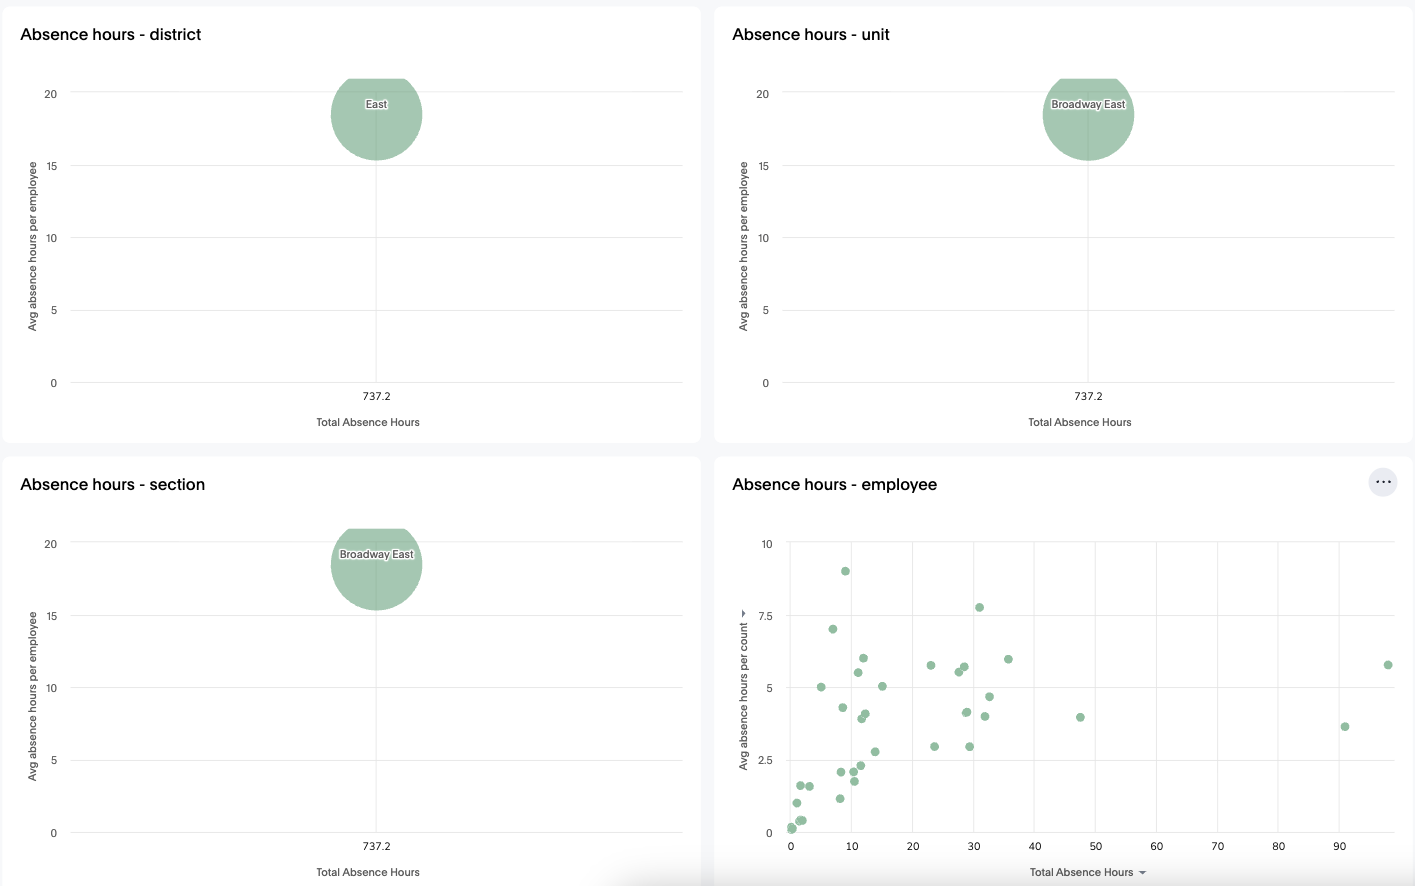
These charts plot:
- Total Absence Hours (x-axis)
- Avg. Absence Hours per Employee (y-axis)
- Bubble size = number of absence events
Available charts:
- Absence hours – district
- Absence hours – unit
- Absence hours – section
- Absence hours – employee
These visuals help identify high-impact teams or individuals.
Absence Hours Over Time (Hierarchy)
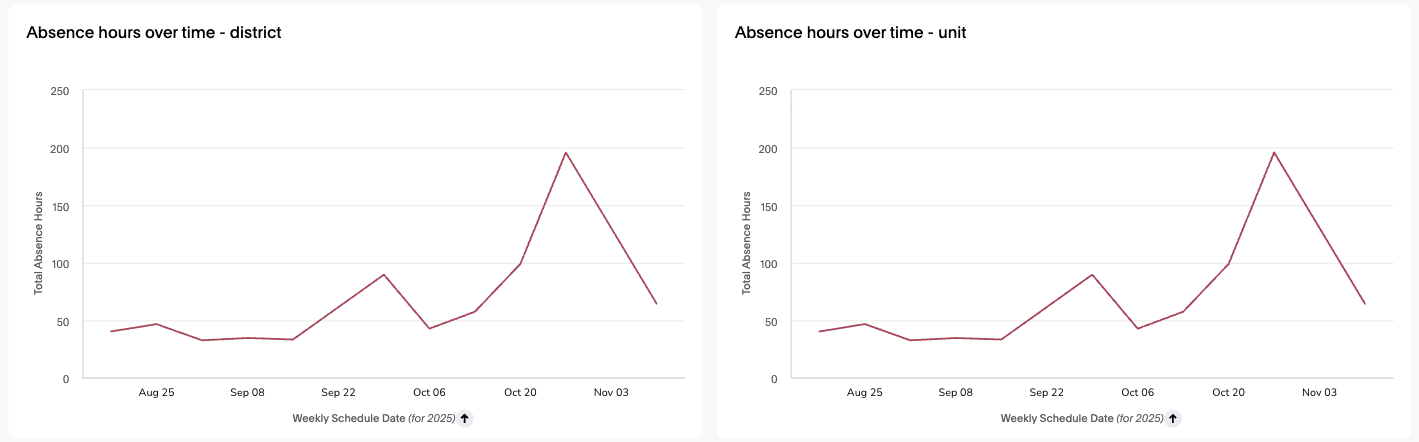
Trend charts for:
- Total Absence Hours by district
- Total Absence Hours by unit
These allow comparison of organizational performance over time.
Employee Details Tab
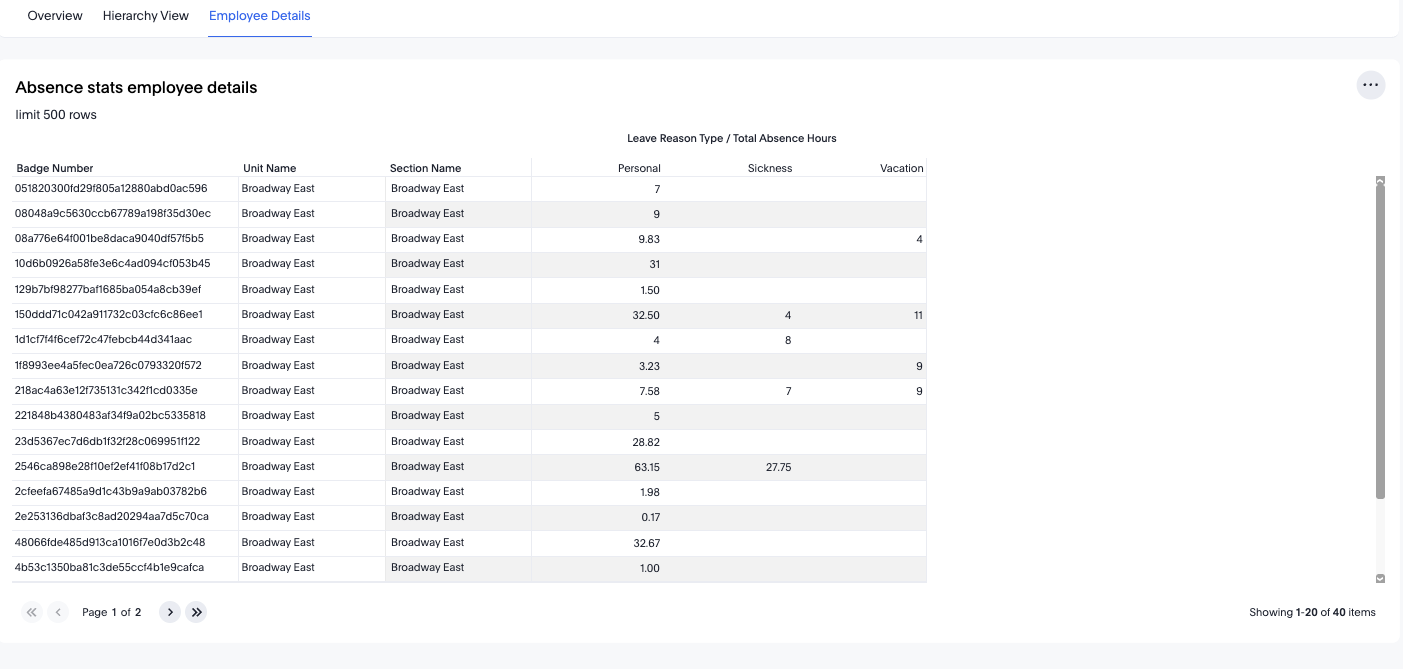
The Employee Details view lists every employee with absence hours in the selected timeframe.
Data columns include:
- Badge Number
- Unit Name
- Section Name
- Leave Reason Type / Total absence hours in each category
- Personal
- Sickness
- Vacation
This table is limited to the first 500 rows for performance, but can be filtered down for easier navigation.
Use this tab to:
- Investigate frequent absentees
- Review absence patterns for individual staff
- Support coaching or absence management conversations
Practical Use Cases
- Identify High-Absence Units
Use hierarchy charts and metrics to find teams with unusually high absence levels.
- Explore Leave Type Patterns
Identify whether sickness, vacation, or personal leave contributes most to total absence hours.
- Detect Seasonal or Weekly Trends
The time-series charts show whether certain weeks or seasons consistently produce higher absence.
- Support Workforce Planning
Use trends to anticipate staffing shortages and adjust scheduling or resources.
- Conduct Employee-Level Investigation
Employee Details lets you examine individual absence patterns for coaching or compliance.
- Monitor Policy Effectiveness
Track changes in specific leave reasons over time following HR policy updates.
Conclusion
The Absences Dashboard provides managers and HR leaders with essential insights into employee availability, leave behaviour, and organizational patterns. With its flexible filters, visual breakdowns, and detailed employee-level records, it helps you better understand and manage absenteeism to maintain healthy staffing levels and operational stability.