Advance Analytics - Salary Analysis dashboard
 Updated
by
Daniel Sjögren
Updated
by
Daniel Sjögren
The Salary Analysis Dashboard provides a complete overview of labour hours and labour-related costs across your organisation. It enables managers, payroll teams, and operational leaders to analyse trends in cost, compare salary types, and drill down to unit, section, or individual employee levels.
This dashboard is especially useful for understanding:
- Total hours worked
- Total calculated labour cost
- Distribution of costs by hour type and salary type
- Trends in hours and cost over time
- Detailed employee-level cost and hour breakdowns

How it works
The Salary Analysis Dashboard includes three core analytical views:
- Overview – A top-level summary of total hours, total labour cost, and cost distribution
- Hierarchy View – Drill-down comparison across districts, units, and sections
- Employee Details – A detailed breakdown of hours and cost per employee
All views support exporting, filtering, and drill-down interactions.
Overview Tab
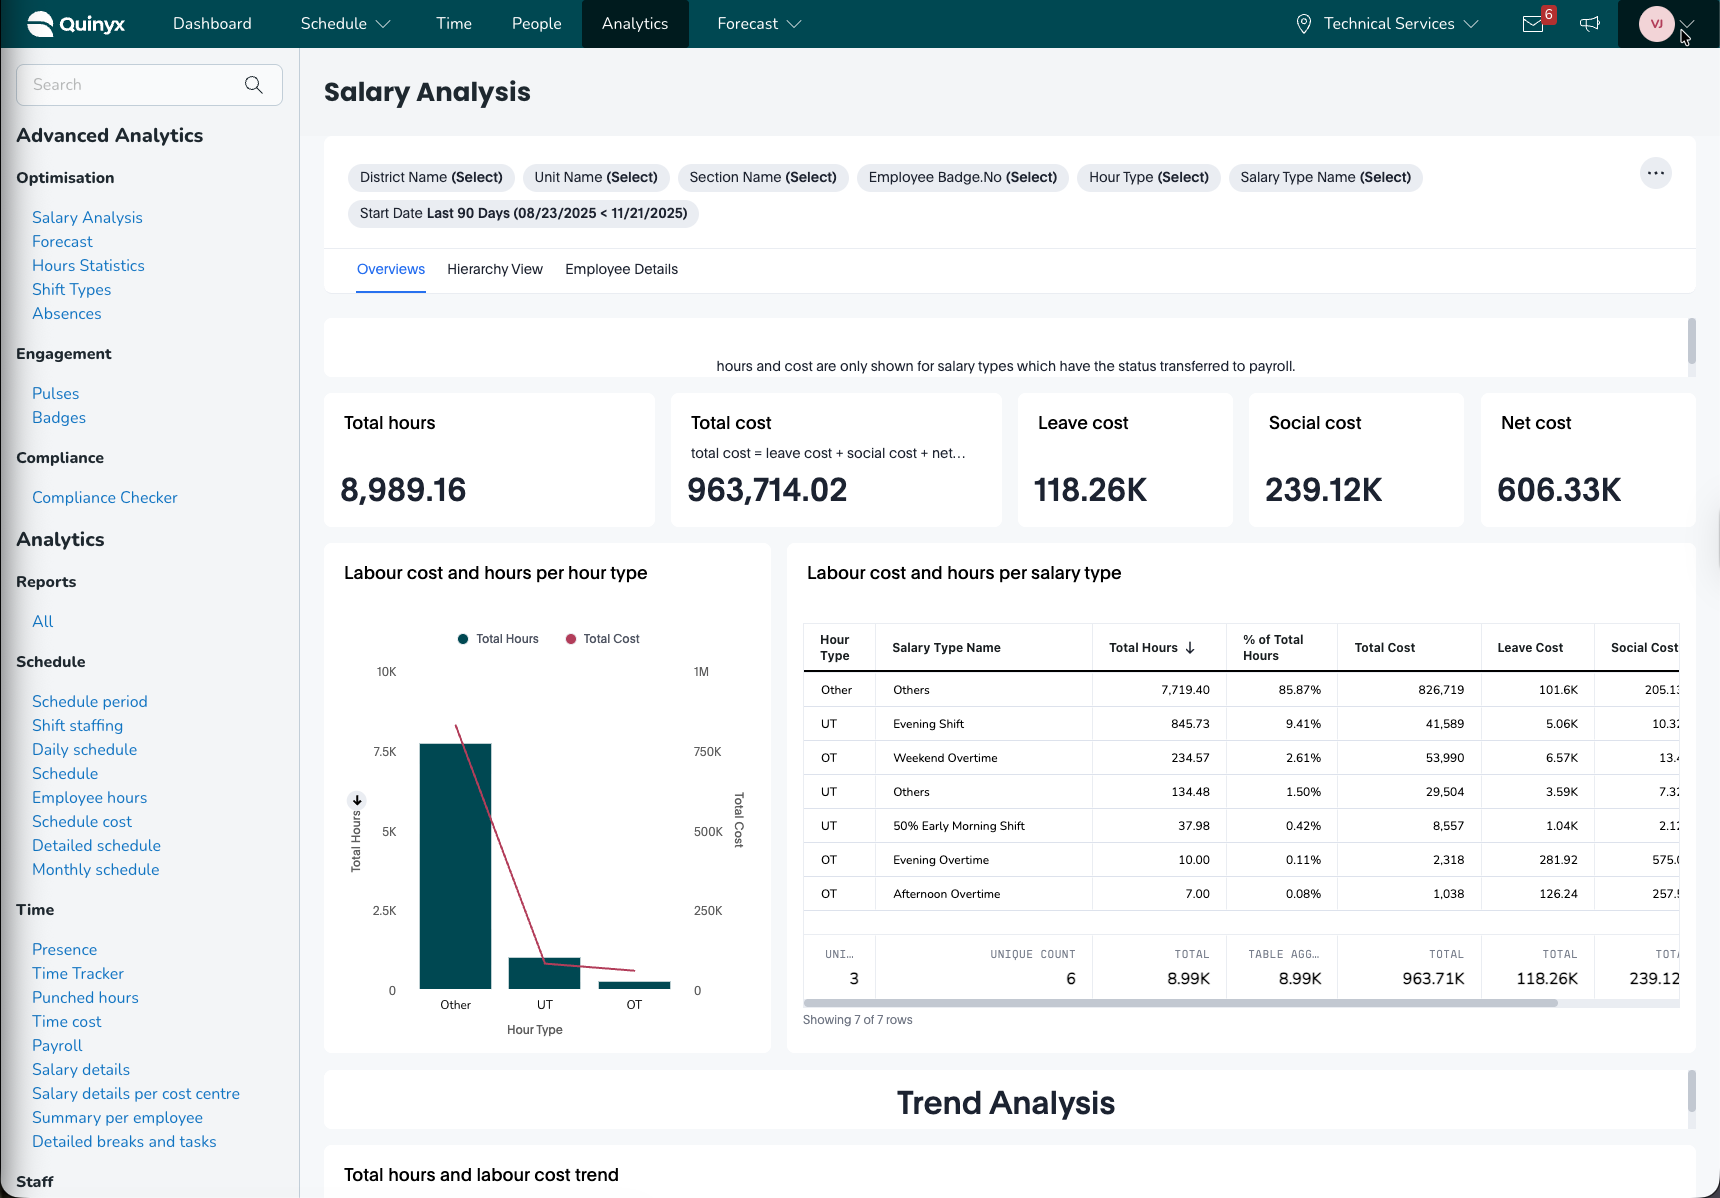
The Overview tab presents all high-level insights related to labour hours and costs for the selected date range.
Headline Metrics
The top section displays the following core KPIs:
- Total hours: Total hours worked in the selected period
- Total cost: Combined cost (leave + social + net cost)
- Leave cost: Total cost associated with leave hours
- Social cost: Social fees or statutory contributions
- Net cost: Base hourly/contractual labour costs
These give an immediate snapshot of organisational labour expenditure.
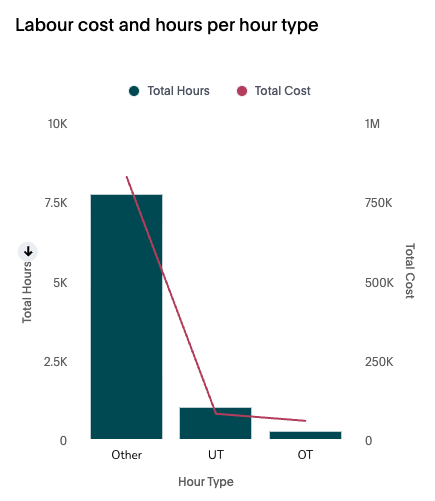
Labour cost & Hours per Hour type(Graph)
This visual chart compares total hours and total cost for each hour type, such as:
- OT (Overtime)
- UT (Unsocial Time / Evening / Weekend)
- Other (Regular hours)
Useful for identifying which hour types drive the largest share of cost.
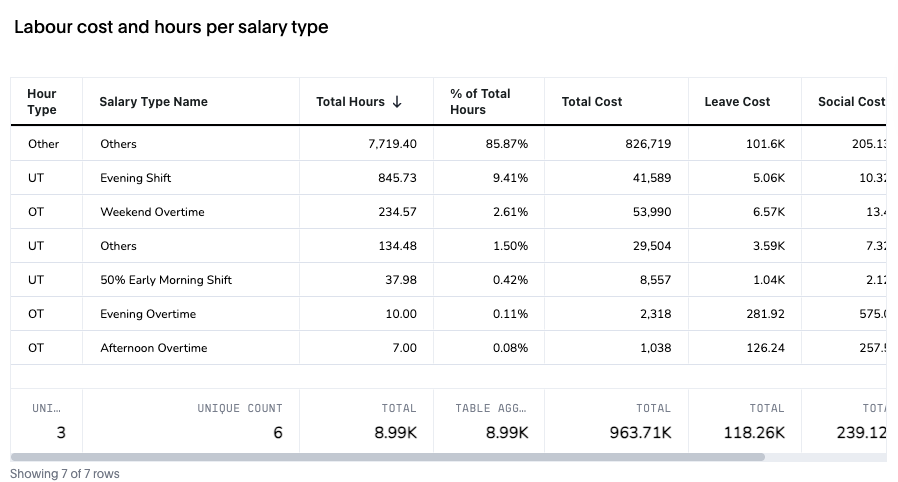
Labour cost & Hours per Salary type(List)
A detailed table showing:
Data Point | Description |
Hour type | Category of hours (OT, UT, regular hours, etc.) |
Salary type name | Salary sub-category (e.g., Evening shift, Weekend overtime, etc.) |
Total hours | Hours worked under that salary type |
% of Total hours | Share of hours in relation to all worked hours |
Total cost | Calculated labour cost |
Leave cost & Social cost | Cost additions for leave and social contributions |
This table helps pinpoint cost-heavy salary types.
Trend Analysis
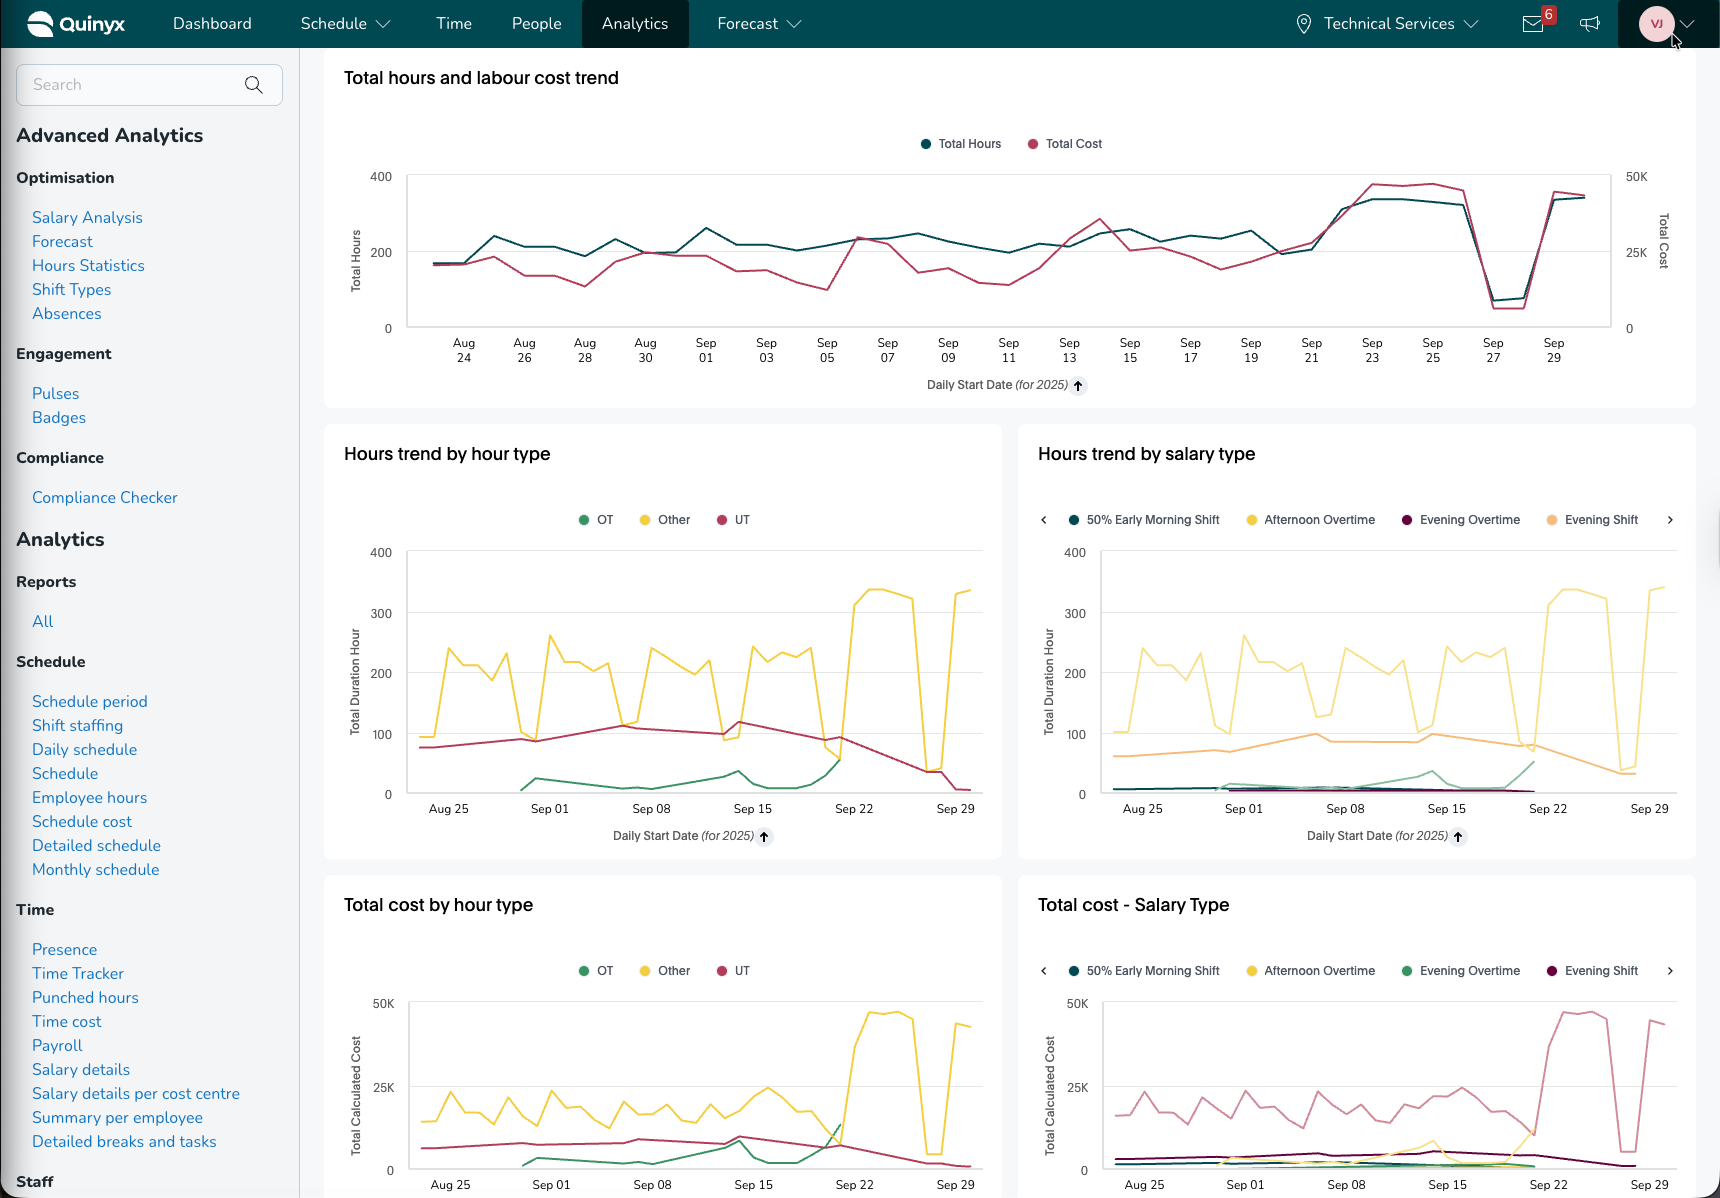
This section provides multiple time-series charts:
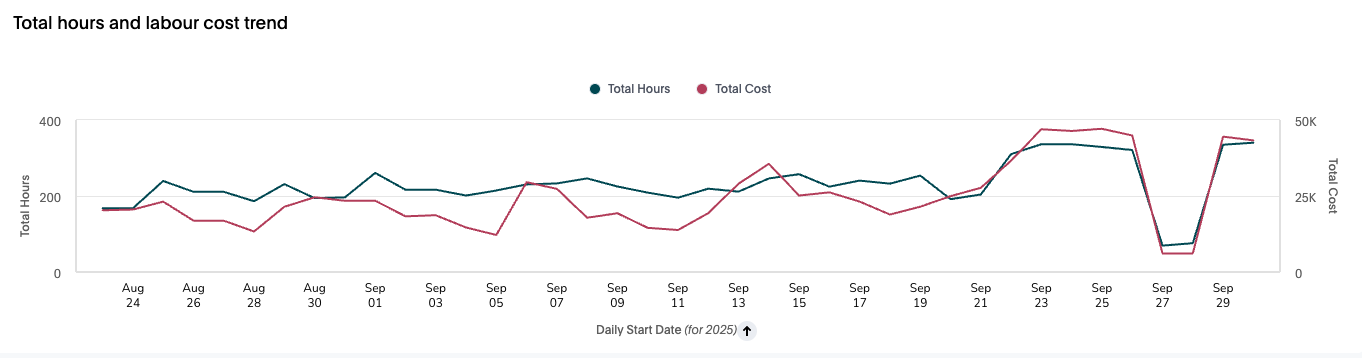
Total hours and labour cost trend
Shows how total hours and total cost develop over time.
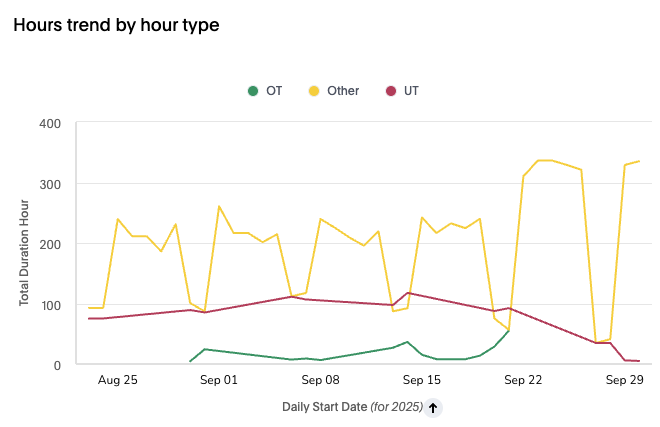
Hours trend by hour type
Breakdown of hours by OT, UT, and Other categories across the timeline.
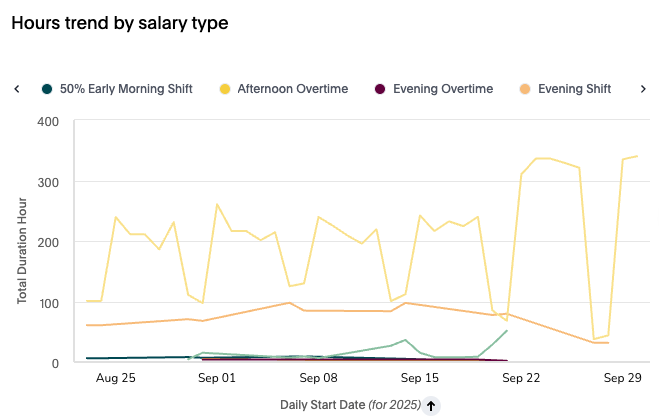
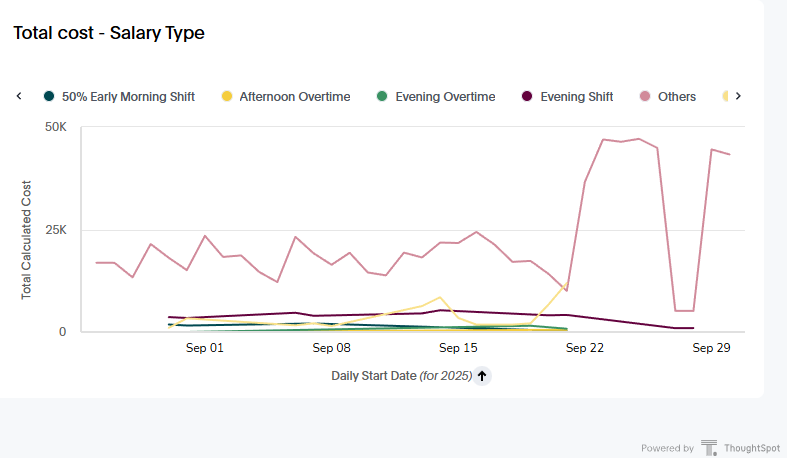
Hours trend by Salary type
Individual salary type trend lines, such as:
- 50% Early Morning shift
- Afternoon overtime
- Evening overtime
- Evening shift
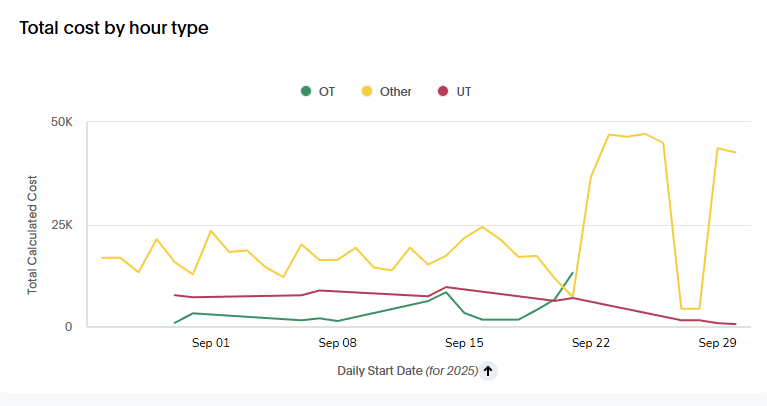
Total cost by Hour type
Displays how costs fluctuate over time for each hour type.
Total Cost by Salary Type
Cost trends for each specific salary type.
These visuals help identify seasonal fluctuations and cost-intensive periods.
Hierarchy View Tab
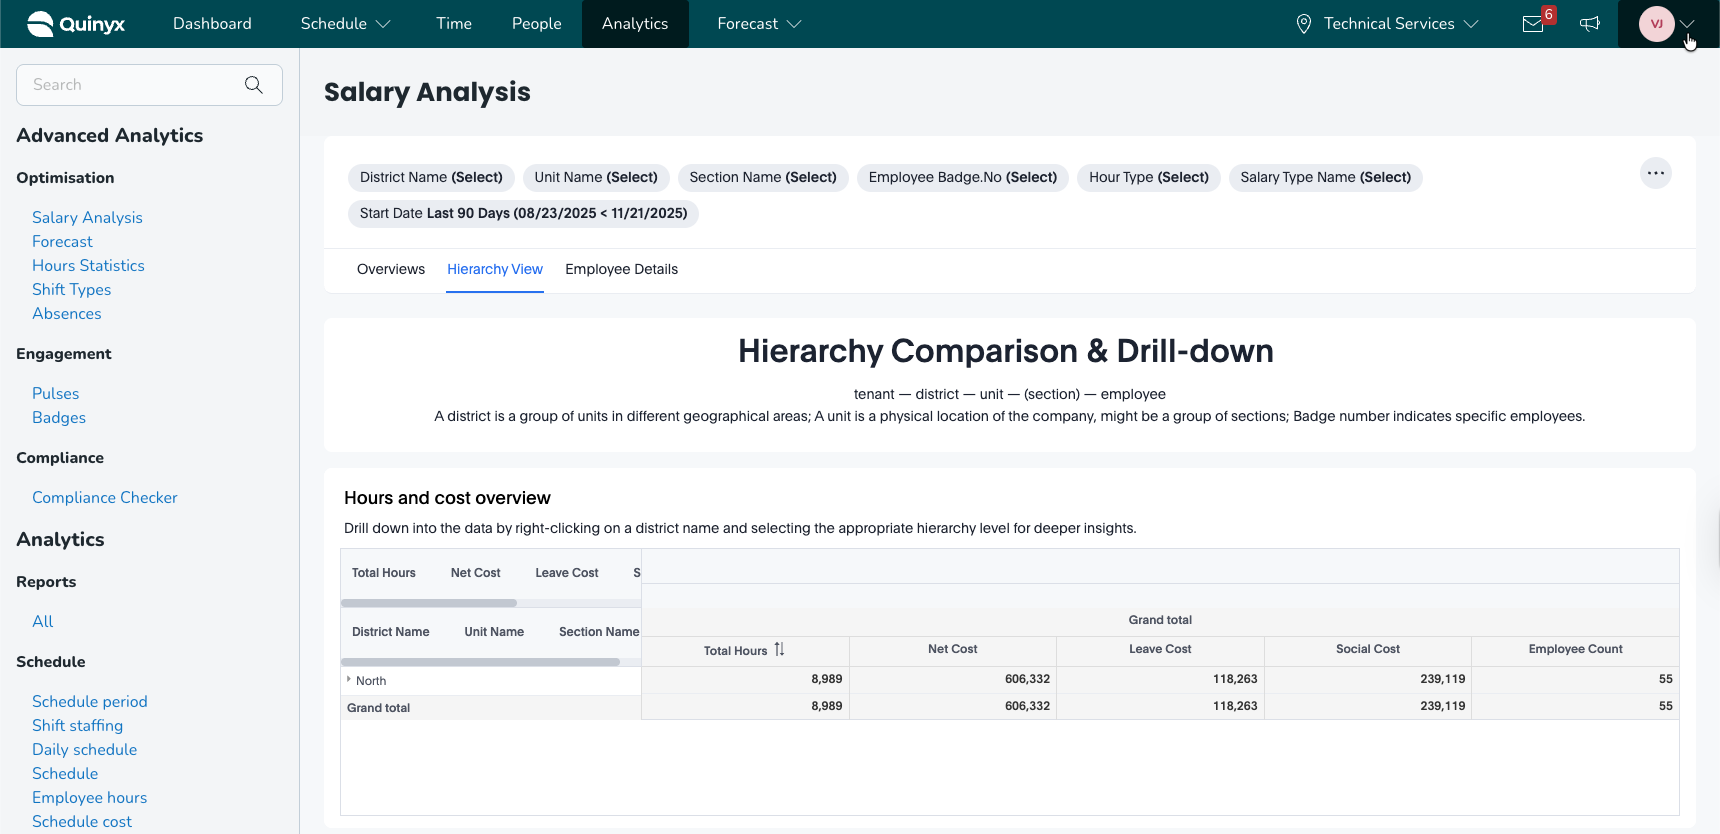
The Hierarchy View allows you to compare hours and labour costs at multiple organisational levels:
Tenant → District → Unit → (Section) → Employee
You can right-click on any element to drill deeper.
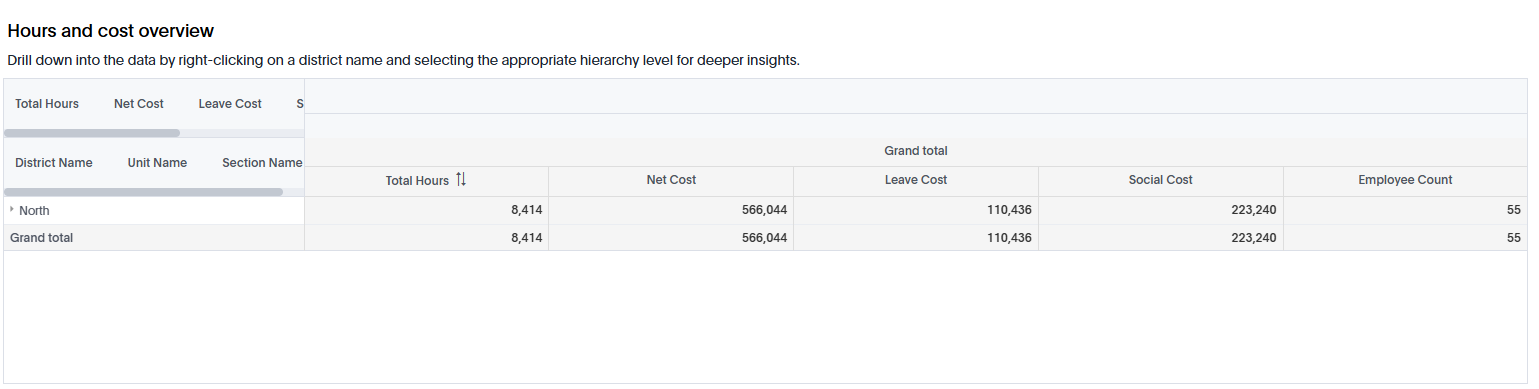
Hours and Cost Overview Table
Shows totals for:
- Hours
- Net Cost
- Leave Cost
- Social Cost
- Employee Count
This enables performance comparison at each level.
Hours and Cost – Bubble Charts
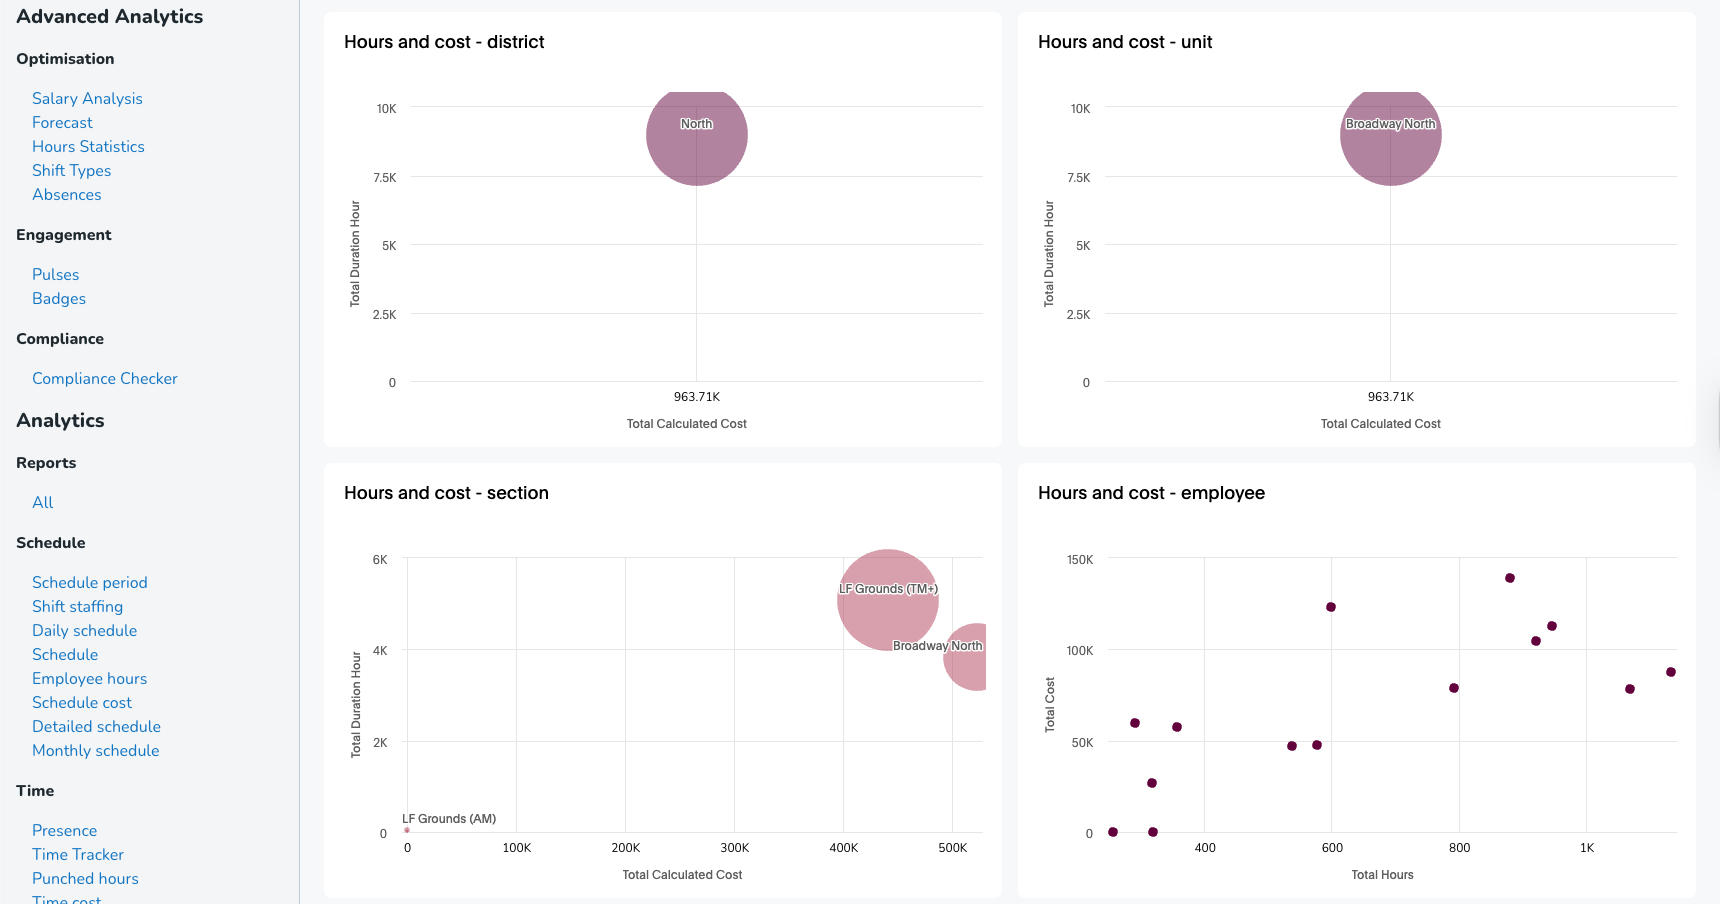
Multiple bubble charts illustrate cost vs hours at various hierarchy levels:
- District
- Unit
- Section
- Employee
Bubble size represents relative cost/volume. X-axis = Total Cost Y-axis = Total Hours
These visuals quickly highlight high-cost or high-hour areas.
Hours Trend – District & Unit
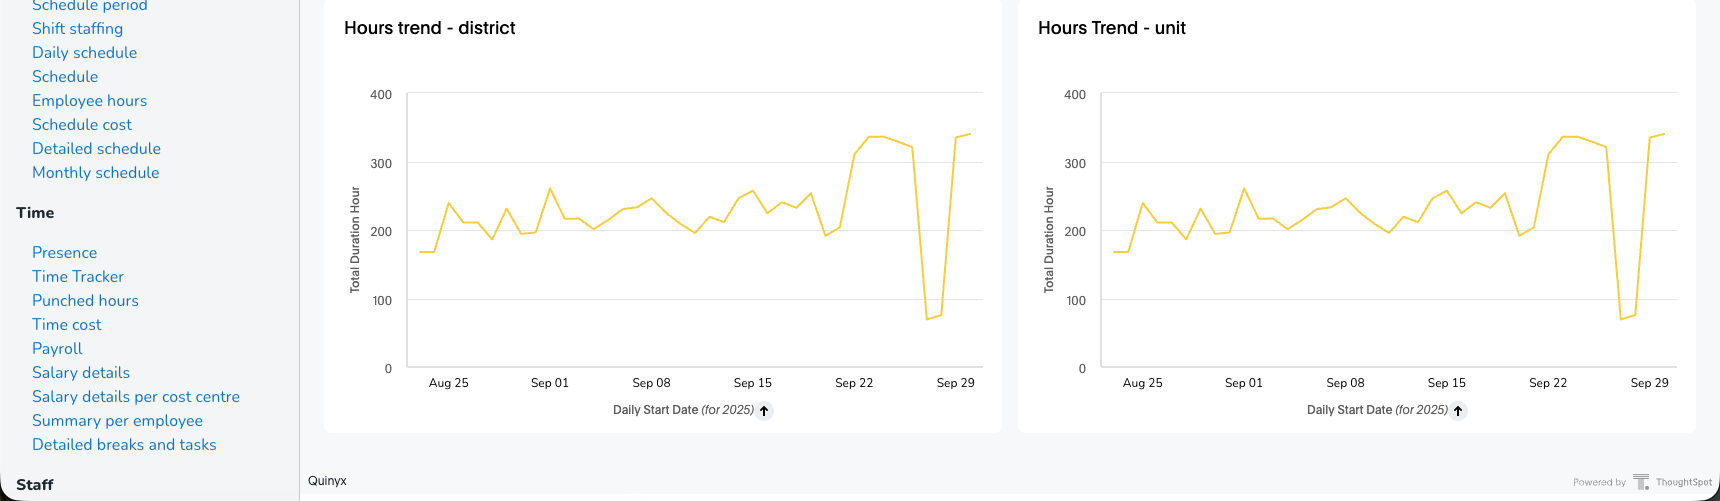
Shows time-based development of total hours per day for:
- Each district
- Each unit
This helps identify outliers or workload shifts.
Employee Details Tab
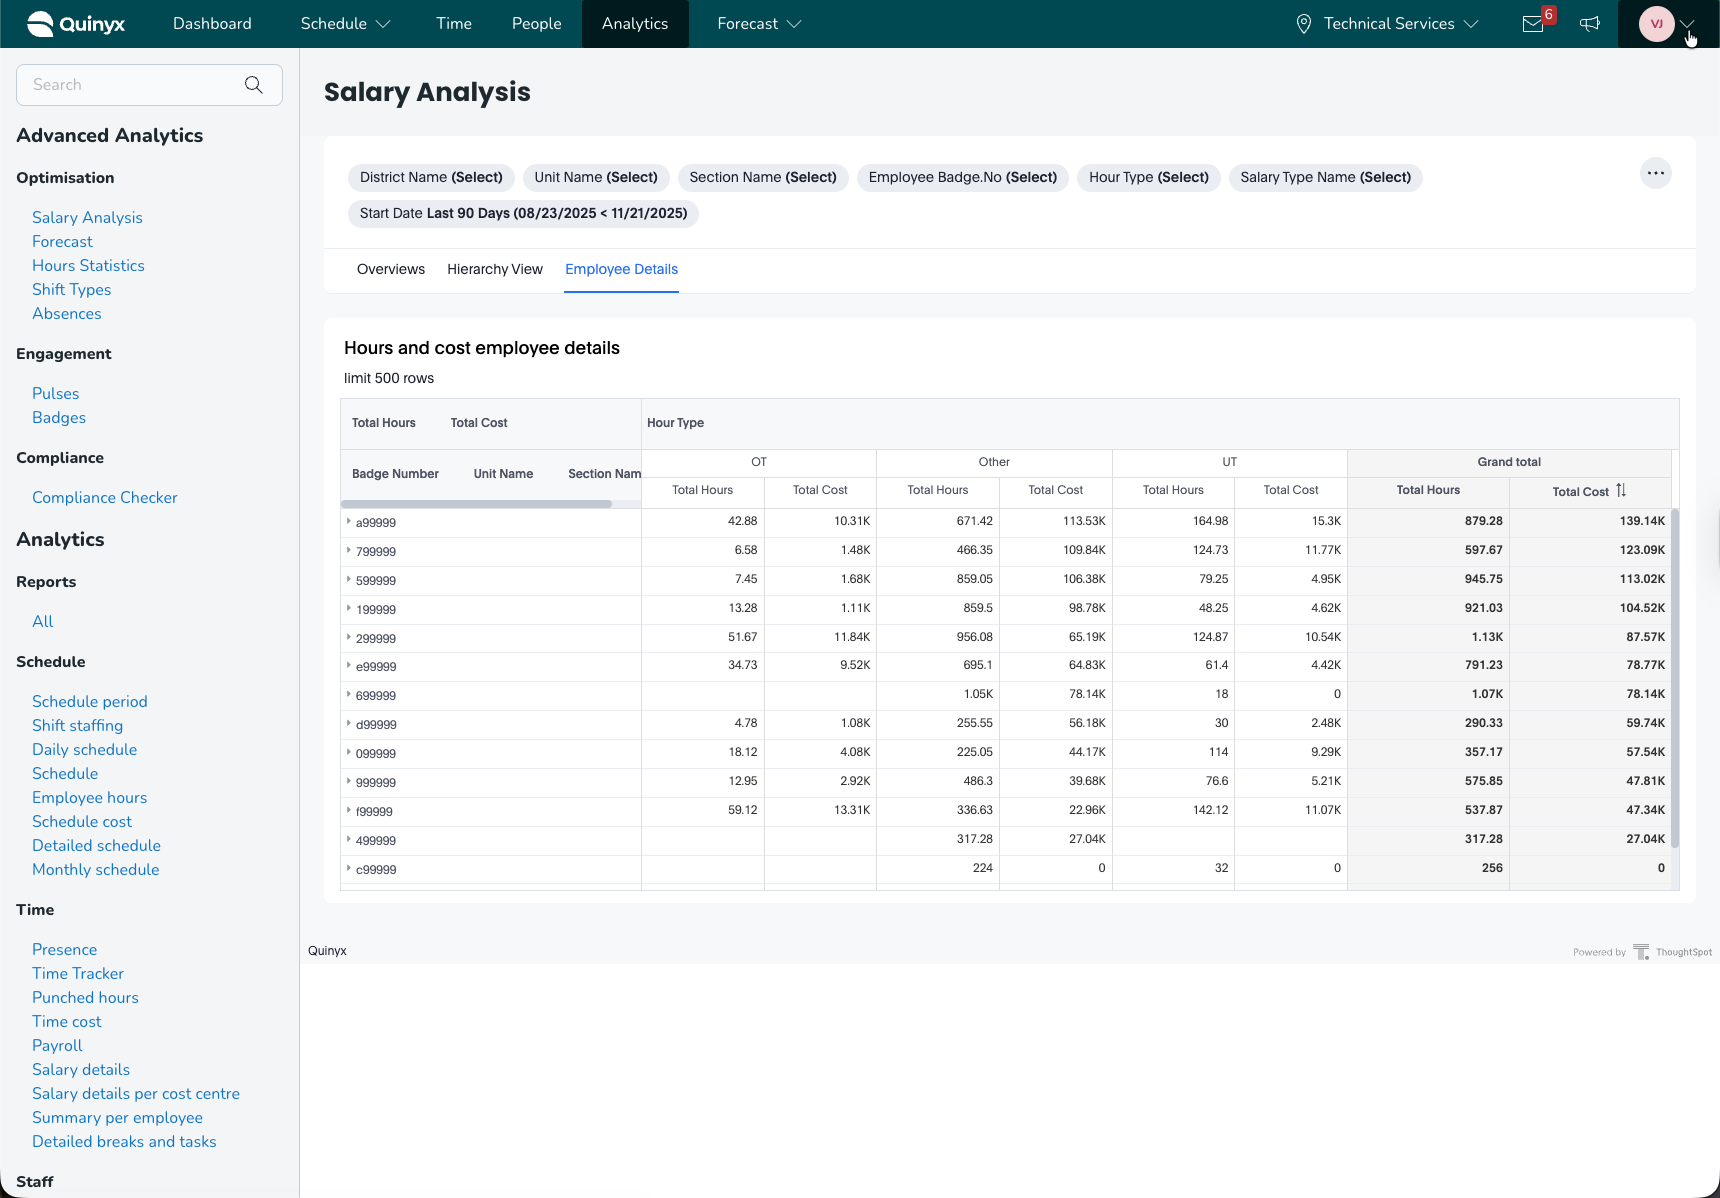
The Employee Details view provides a detailed table of hours and cost per employee, restricted to the first 500 rows.
Metrics included:
- Badge Number
- Unit Name & Section Name
- Total Hours by Hour Type (OT, UT, Other)
- Total Cost by Hour Type
- Grand Total Hours & Cost
This table is useful for:
- Payroll validation
- Identifying high-cost employees
- Reviewing overtime distribution
- Preparing HR or cost-analysis reports
Practical Use Cases
1. Identify High-Cost Salary Types
Use the Overview’s salary type table to find salary types that disproportionately raise labour costs.
2. Track Overtime Trends
View hour type trend charts to identify problematic overtime peaks.
3. Compare District or Unit Efficiency
Use Hierarchy view bubble charts and tables to compare performance across geography or business units.
4. Support Payroll Reconciliation
Use Employee details to validate hour totals and cost allocations per employee.
5. Improve Workforce Planning
Combine the hour trends and cost trends to forecast labour needs more accurately.
6. Detect Anomalies
Sudden cost spikes, missing hours, or large negative dips can signal:
- Incorrect scheduling
- Data errors
- Unexpected overtime
Conclusion
The Salary analysis dashboard equips managers, payroll teams, and operational leaders with deep insights into labour cost distribution, salary type utilization, and time-based patterns. Its combination of high-level metrics, hierarchy drill-down, and employee-level granularity makes it a powerful tool for operational and financial optimisation.